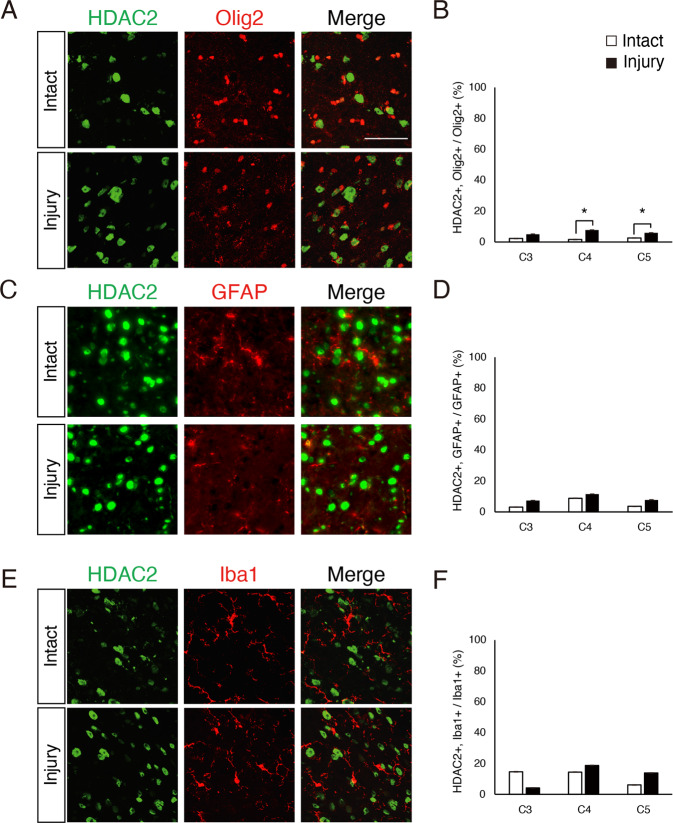
Fig. 6. Increased HDAC2 expression in Olig2-positive cells in the cervical cord.
a, c, e Representative images of immunohistochemical staining with anti-HDAC2 and anti-Olig2 (a), anti-GFAP (c), or anti-Iba1 (e) antibodies in transverse sections of the cervical spinal cord, scale bar: 50 μm. b, d, f The percentage of HDAC2-expressing cells among the indicated co-labeled cells was quantified in the denervated side of the cervical cord. The percentage of HDAC2-expressing Olig2-positive cells was significantly increased. n = 3. Student′s t-test.

