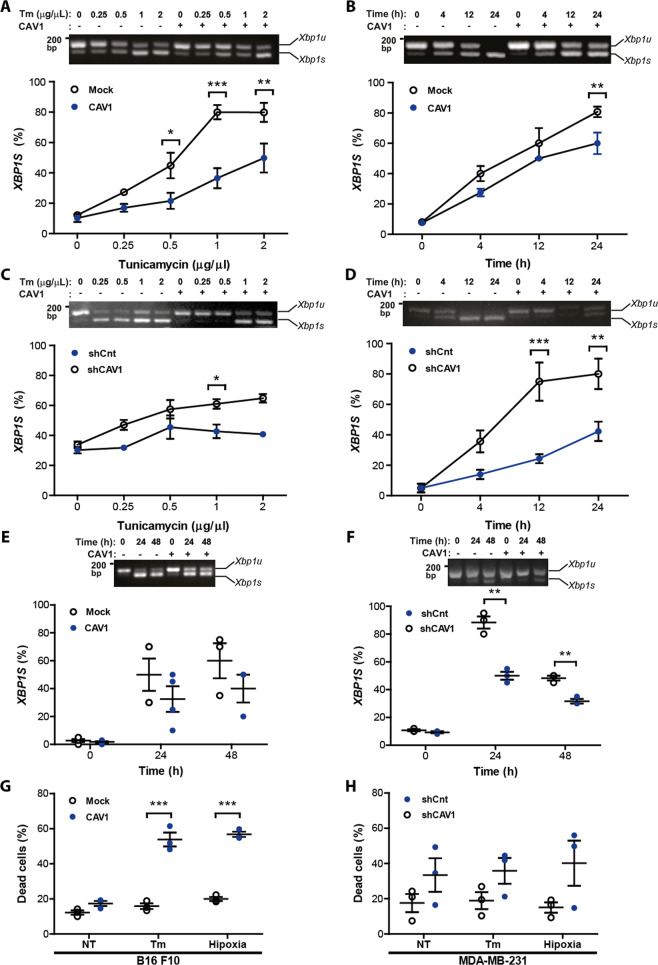
Fig. 3. CAV1 expression reduced tunicamycin and hypoxia induced UPR and increased cell death in B16F10 and MDA-MB-231 cells.
B16F10(Mock) and B16F10(CAV1) cells were cultured in RPMI supplemented with FBS 10% for 48 h in the presence of IPTG (1 mM). MDA-MB-231 shCnt or shCAV1 cells were cultured in DMEM/F12 medium supplemented with 10% FBS for 48 h. Afterwards, both cell lines were treated with Tm or exposed to hypoxia. a B16F10(Mock) and B16F10(CAV1) cells were treated with increasing concentrations of Tm (0.25–2 μg/μL) for 4 h. Then, cells were collected, and total RNA was obtained. Signaling downstream of IRE1α was monitored by quantifying XBP1 mRNA splicing as described (n = 3, mean ± SEM, two-way repeated measures ANOVA, *p < 0.05, **p < 0.01, ***p < 0.001; mean = line). b Cell lines shown in a were treated with 0.5 μg/μL Tm up to 24 h and XBP1 mRNA splicing was quantified as described (n = 4, mean ± SEM, two-way ANOVA, **p < 0.01). c MDA-MB-231(shCnt) or MDA-MB-231(shCAV1) cells were also evaluated as indicated above. Representative results in MDA-MB-231 cells for XBP1 splicing using increasing concentrations of Tm (n = 3, mean ± SEM, two-way ANOVA, *p < 0.05) d MDA-MB-231(shCnt) or MDA-MB-231(shCAV1) cells were treated with 0.5 μg/μL Tm up to 24 h and XBP1 mRNA splicing was quantified as described (n = 3, mean ± SEM, two-way repeated measures ANOVA, **p < 0.01, ***p < 0.001). e B16F10(Mock) and B16F10(CAV1) cells were cultured for 48 h and then exposed to hypoxia (1% O2) for 24 or 48 h. IRE1α signaling was assessed by the XBP1 splicing assay (n = 4, mean ± SEM). f The same experiments described in e were carried out in the MDA-MB-231 cell line (n = 3, mean ± SEM, two-way repeated measures ANOVA, **p < 0.01, ***p < 0.001). g B16F10(Mock) and B16F10(CAV1) cells were treated with Tm (0.5 μg/μL) or exposed to hypoxia for 24 h and cell death was determined by flow cytometry analysis following propidium iodide staining (n = 3, mean ± SEM, two-way repeated measures ANOVA, ***p < 0.001, mean ± SEM). h MDA-MB-231(shCnt) and MDA-MB-231(shCAV1) cells were treated with Tm (0.5 μg/μL) or exposed to hypoxia for 24 h and cell death was determined by flow cytometry analysis following propidium iodide staining (n = 3, mean ± SEM).

