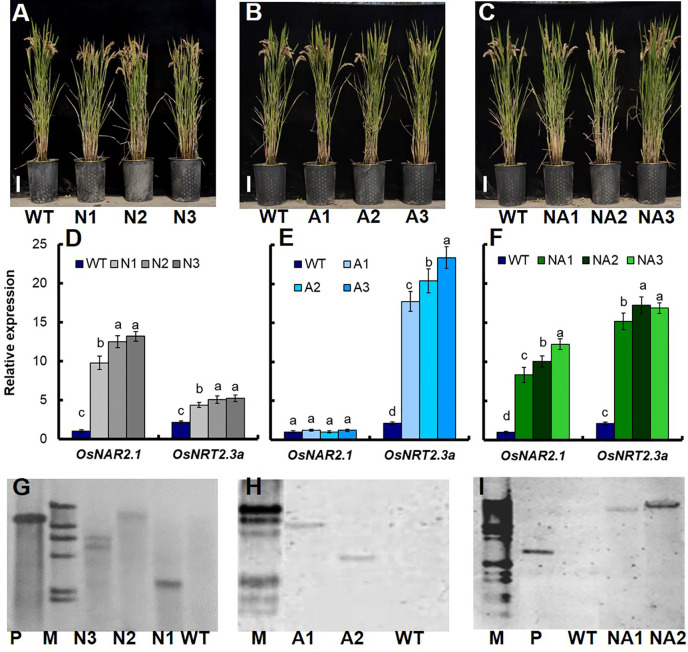
Figure 1.
Identification of transgenic lines. Phenotype of (A) p35S:OsNAR2.1 transgenic lines (N1, N2, and N3), (B) p35S:OsNRT2.3a transgenic lines (A1, A2, and A3), and (C) p35S:OsNAR2.1-p35S:OsNRT2.3a transgenic lines (NA1, NA2, and NA3). qRT-PCR analysis the expression of OsNAR2.1 and OsNRT2.3a of (D) p35S:OsNAR2.1 transgenic lines, (E) p35S:OsNRT2.3a transgenic lines, and (F) p35S:OsNAR2.1-p35S:OsNRT2.3a transgenic lines. RNA was extracted from culm. Error bars: SE (n = 3). The different letters indicate a significant difference between the transgenic line and the WT (P < 0.05, one-way ANOVA). Southern blot analysis the copy number of (G) p35S:OsNAR2.1 transgenic line, (H) p35S:OsNRT2.3a transgenic lines, and (I) p35S:OsNAR2.1-p35S:OsNRT2.3a transgenic lines. Genomic DNA isolated from T2 generation transgenic plants was digested with the Hind III and EcoR I restriction enzymes. A G418 gene probe was used for hybridization. P, positive control; M, marker.

