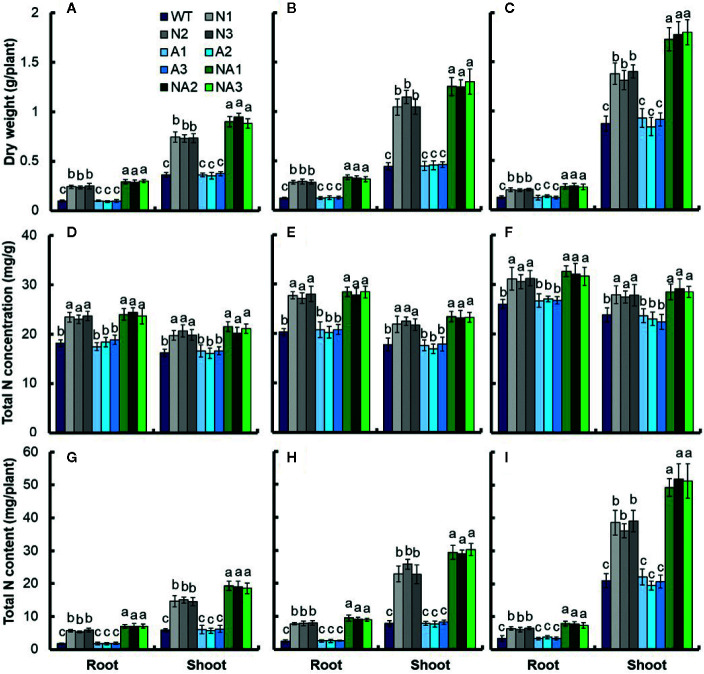
Figure 6.
Total nitrogen content of transgenic plants at different nitrogen supply levels. WT and transgenic rice seedlings in the solution containing 1 mM NH4 + of IRRI for 2 weeks, and in different forms of nitrogen for 3 additional weeks. Dry weight of seedlings treated with (A) 0.2 mM NO3 –, (B) 2.5 mM NO3 –, and (C) 1.25 mM NH4NO3; Total nitrogen concentration of seedlings treated with (D) 0.2 mM NO3 –, (E) 2.5 mM NO3 –, and (F) 1.25 mM NH4NO3; Total N content of seedlings grown with (G) 0.2 mM NO3 –, (H) 2.5 mM NO3 – and (I) 1.25 mM NH4NO3. Error bars: SE (n = 4). The different letters indicate a significant difference between the transgenic line and the WT (P < 0.05, one-way ANOVA).

