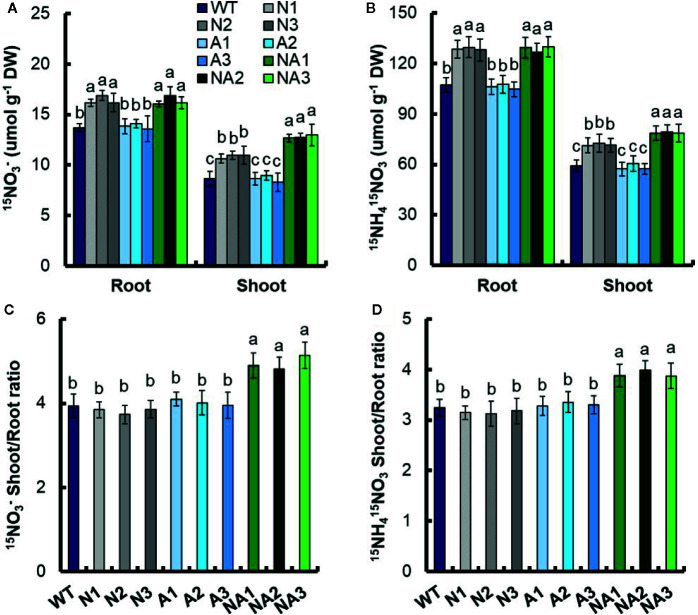
Figure 8.
15N concentration and 15N distribution ratio in WT and transgenic lines. WT and transgenic seedlings were grown in 1 mM NH4 + for 3 weeks and nitrogen starved for 1 week. 15N concentration in the roots and shoots of the WT and transgenic lines under the nutrient solution containing (A) 0.2 mM 15NO3 – or (B) 1.25 mM 15NH4 15NO3 for 12 h. The shoot-to-root ratio of the total 15N content at (C) 0.2 mM NH4 + or (D) 1.25 mM 15NH4 15NO3. DW, dry weight. Error bars: SE (n = 4). The different letters indicate a significant difference between the transgenic line and the WT (P < 0.05, one-way ANOVA).

