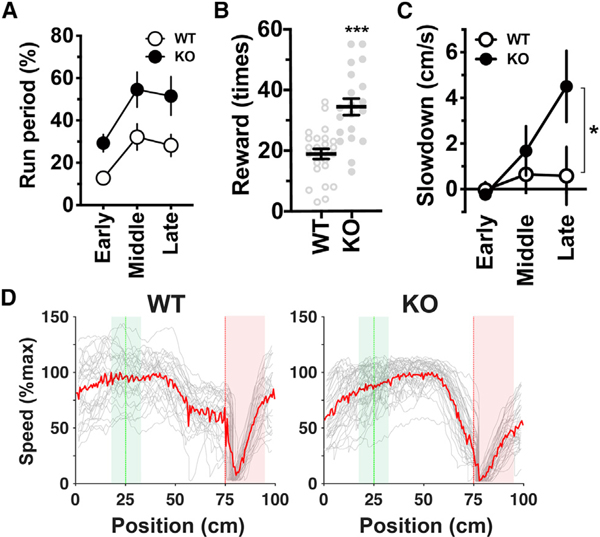
Figure 6. Enhanced Goal-Directed Behavior of Shank2-Deficient Mice.
(A) The fraction of time spent running for the early (sessions 1–5), middle (sessions 6–10), and late (sessions 11–15) phases of training in wild-type (WT) and Shank2-deficient (KO) mice (WT versus KO, p = 0.025, F(1,7) = 8.14, two-way ANOVA, n = 5 WT and 4 KO mice).
(B) The number of rewards obtained in sessions in the late training phase. ***p < 0.0001 versus WT, t(43) = 5.07; unpaired two-tailed t test, n = 25 and 20 sessions from 5 WT and 4 KO mice, respectively.
(C) Slowdown before the reward delivery point *p = 0.031, F(1, 7) = 2.199, t(21) = 2.811, two-way ANOVA with the Holm-Sidak test, n = 5 WT and 4 KO mice. (A–C) Data are expressed as mean ± SEM.
(D) Examples of trial-by-trial (gray) and average (red) running speed plotted against position for WT (left) and KO (right) mice in single sessions in the late training phase.

