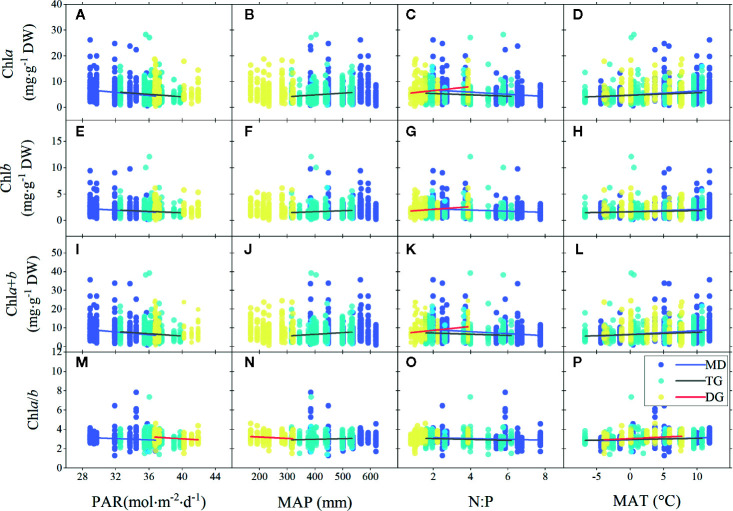
Figure 5.
Linear regressions of chlorophyll concentrations (chla, chlb, and chla+b) and ratio (chla/b) with major environmental factors grouped by grassland types. (A–D), (E–H), (I–L), and (M–P) denote regressions of chla, chlb, chla+b, and chla/b to four environmental factors, respectively. MD, meadow; TG, typical grassland; DG, desert grassland; PAR, photosynthetic active radiation; MAP, mean annual precipitation; N:P, ratio of soil nitrogen to soil phosphorus; MAT, mean annual temperature. Lines denote significant linear fitted relationships (p < 0.05).

