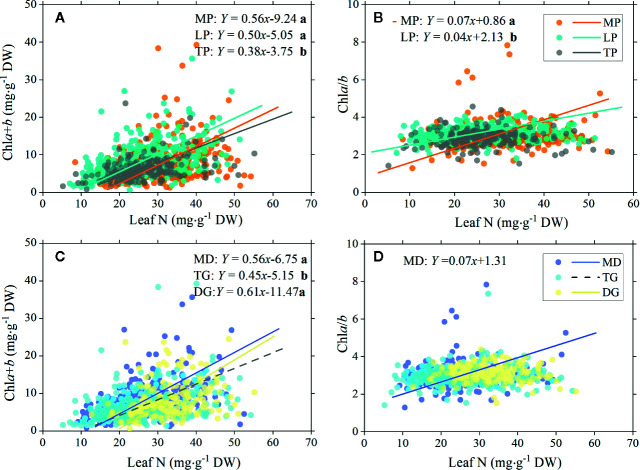
Figure 6.
Standardized major axis (SMA) regression of chlorophyll total concentration (chla+b) and ratio (chla/b) to leaf N for different regions and grassland types. Relationships between total chlorophyll concentration and leaf nitrogen (A), and between chlorophyll ratio and leaf nitrogen (B) for three plateau regions are showed , respectively. Corresponding relationships between chlorophyll and leaf nitrogen in three grassland types are showed in (C, D). Lines denote significant linear relationships (p < 0.05). Fitting functions are given only for significant linear relationships. Different lowercase letters behind functions indicate significant difference between SMA slopes (p < 0.05). MP, Mongolia Plateau; LP, Loess Plateau; TP, Tibet Plateau; MD, meadow; TG, typical grassland; DG, desert grassland.

