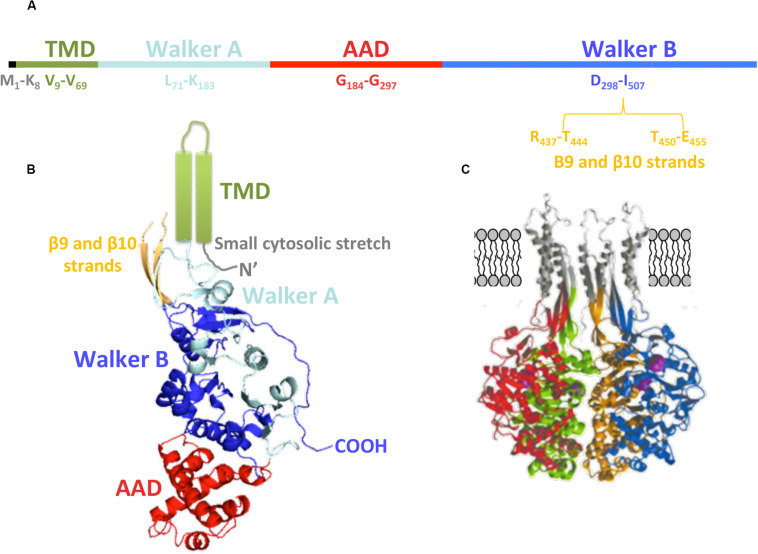
FIGURE 4.
TrwBR388 structure. (A) Primary structure. The location of the domains along the sequence is shown. (B) Diagram of TrwBΔN70 monomer. The different domains are colored as in panel (A). The TMD (green), not solved in the crystal structure, is represented as two cylinders. Regarding β9 and β10 strands (orange), only their structurally solved parts are shown (PDB: 19E6). (C) Representation of four monomers (each of them in a different color) with in silico modeled TMD, β9, and β10 strands (gray). Panel (C) adapted from Gomis-Rüth et al. (2002a).

