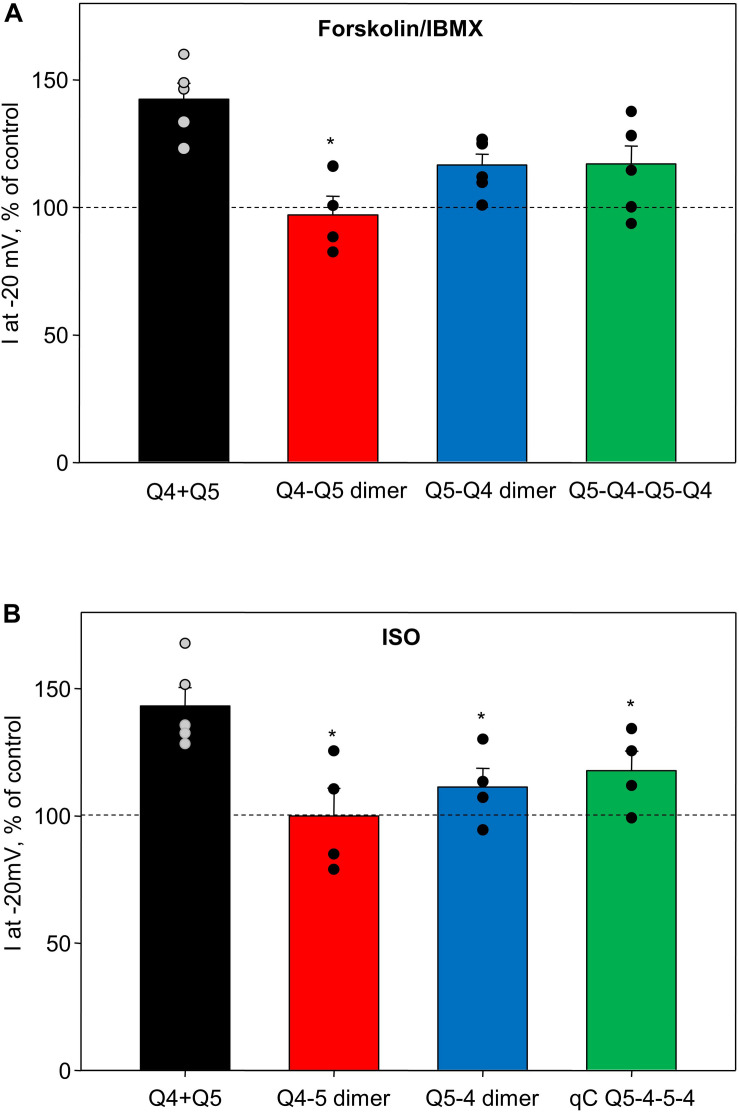
FIGURE 4.
Summary of forskolin/IBMX and isoproterenol-induced increase in current amplitude of Q4–Q5 dimers, Q5–Q4 dimers, and Q5–Q4–Q5–Q4 tetramers, in comparison with M-currents through channels formed from co-expressed individual Kv7.4 and Kv7.5 α-subunits (Q4 + Q5). (A) Summarized bar graph of forskolin/IBMX (10 and 500 μM, respectively) -induced current enhancement through co-expressed individual Kv7.4 and Kv7.5 channels (Q4 + Q5, black, n = 5), Q4–Q5 dimer (red, n = 4), Q5–Q4 dimers (blue, n = 6), and Q5–Q4–Q5–Q4 tetramers (green, n = 6), measured at −20 mV. *Significant difference from co-expressed individual Kv7.4 and Kv7.5 channels (P = 0.002, One Way ANOVA). (B) Summarized bar graph of isoproterenol (1 μM)-induced current enhancement through co-expressed individual Kv7.4 and Kv7.5 channels (Q4 + Q5, black, n = 5), Q4–Q5 dimer (red, n = 4), Q5–Q4 dimers (blue, n = 4), and Q5–Q4–Q5–Q4 tetramer (green, n = 4), measured at −20 mV. *Significant difference from co-expressed individual Kv7.4 and Kv7.5 channels (P = 0.015, One Way ANOVA). Dashed lines indicate control current level.

