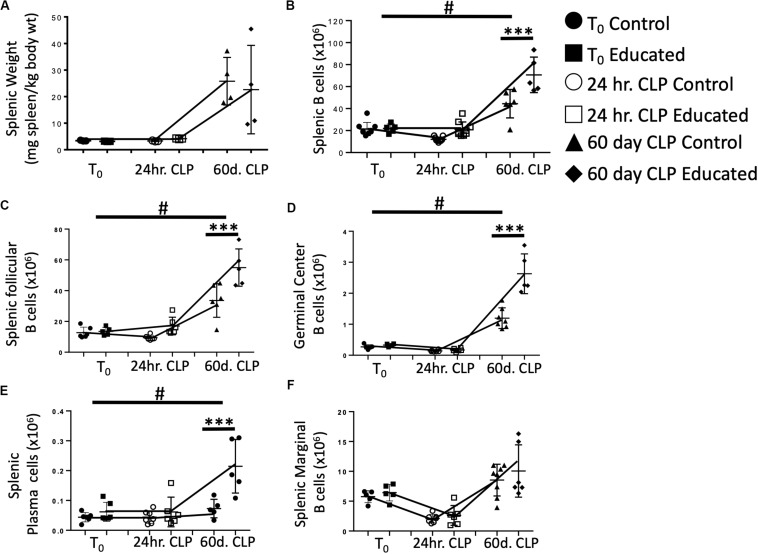
FIGURE 5.
Effects of immune education on Splenic Weight and B cell populations at T0, 24 h and 60 days post-CLP. C57Bl/6 laboratory mice underwent education or treatment with isotype control antibody. Thirty-five days later mice were euthanized (T0) or subjected to CLP. Mice subjected to CLP were euthanized 24 h (24 h CLP) or 60 days (60 days CLP) later. Spleens were weighed and homogenized and B cell populations were analyzed using flow cytometry. Each point represents results in an individual animal, central horizontal line indicates mean, upright and inverted Ts indicate standard deviation, data representative of two independent experiments. Filled circles – T0 in control mice; Filled square – T0 in immune educated mice; Open circle – 24 h post-CLP in control mice; Open square – 24 h post-CLP in immune educated mice. Data analyzed using two-way ANOVA with Sidak’s post hoc correction for multiple comparisons. #, slope of line connecting T0 mean and mean 24 h post-CLP significantly different than slope of line for control mice. ***p < 0.001, significantly different from value in control mice at same time point; #p < 0.05, slope of line connecting mean at T0 to mean value 24 h post-CLP significantly different than same line in control mice. (A) Splenic weight normalized to pre-CLP body weight. N = 4/group. (B) Total splenic B cells. Gating: FSC/SSC, singlets, Live, CD19+/B220+; N = 3–4/group. (C) Total follicular B cells. Gating: Follicular B cells: FSC/SSC, singlets, Live, CD19+/B220+, CD93–, B220+/CD138–, IgMlo/CD21/35lo; N = 4/group. (D) Total germinal center B cells. Gating: FSC/SSC, singlets, Live, CD19+/B220+, CD93–, B220+/CD138–, IgMlo/CD21/35lo, GL7+; N = 4/group. (E) Total plasma cells. Gating: FSC/SSC, singlets, Live, CD19+/B220+, CD93–, B220+/CD138+; N = 4/group. (F) Total marginal zone B cells. Gating: FSC/SSC, singlets, Live, CD19+/B220+, CD93–, B220+/CD138–, IgMhi/CD21/35hi; N = 4/group.

