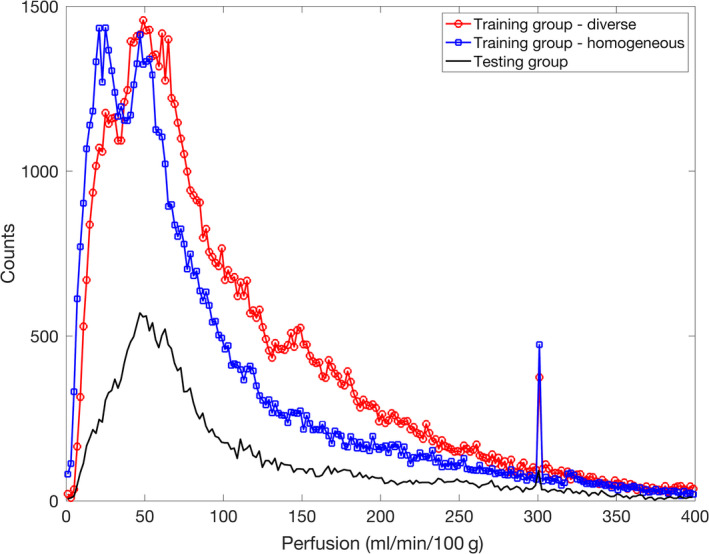
Figure 3.

Histogram of perfusion values in the training and testing groups. Median and mean for the diverse training group (20 datasets) were 80.8 and 106.6, for the homogeneous training group (20 datasets) were 62.8 and 91.9, and for the testing group (eight datasets) were 72.4 and 103.8 ml min−1 100 g−1. The spikes at perfusion value of 300 ml min−1 100 g−1 were because for multiple voxels presumably with high perfusion, the model fitting ended at a local optimum with the initially chosen perfusion value unchanged at 300
