Figure 3.

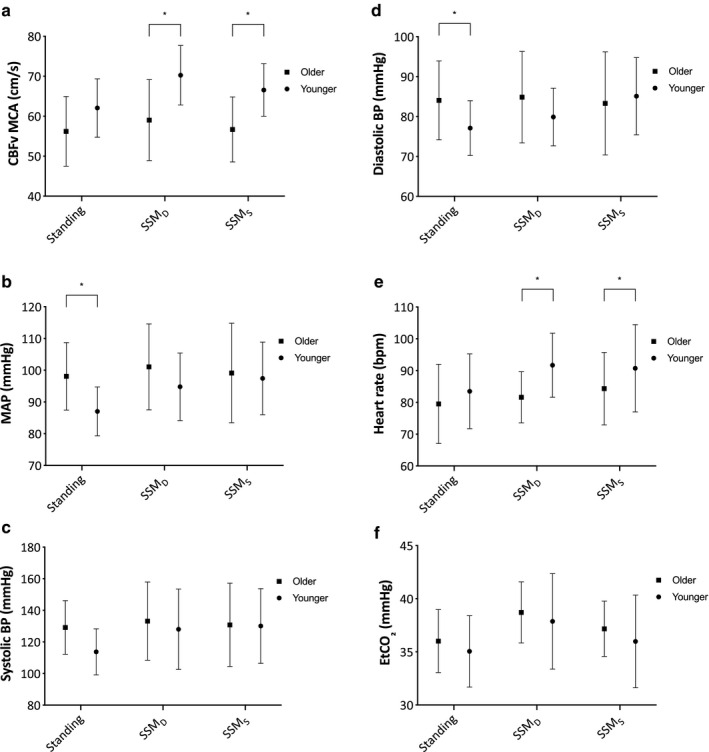
Mean CBFv (a), MAP (b), Systolic BP (c), Diastolic BP (d), Heart rate (e), and EtCO2 (f) for each recording in the older (squares) and younger (circles) groups. Error bars represent SD. *p < .05

Mean CBFv (a), MAP (b), Systolic BP (c), Diastolic BP (d), Heart rate (e), and EtCO2 (f) for each recording in the older (squares) and younger (circles) groups. Error bars represent SD. *p < .05