
FIGURE 5.
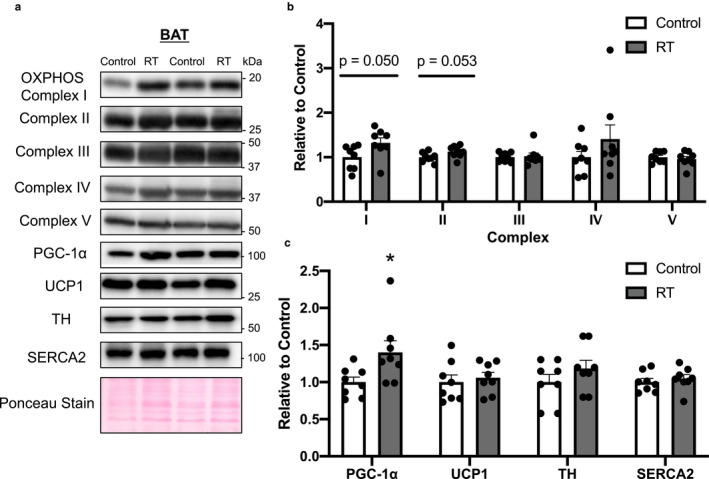
The effects of 4 weeks of resistance training on protein expression in brown adipose tissue (BAT). Representative Western blot images of each specific band (a). Protein contents of OXPHOS (b), PGC‐1α, UCP‐1, TH, and SERCA2 (c) in BAT. Ponceau staining was used as a loading control. n = 8 in each group. Mean ± SEM. *p < .05