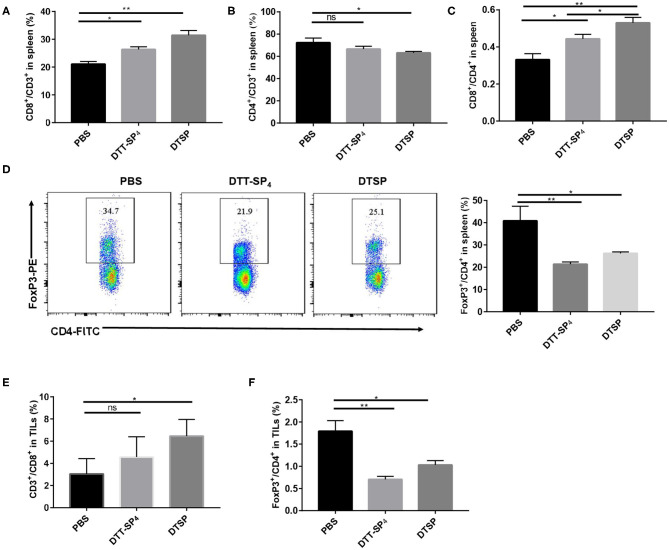
Figure 6.
Distribution of CD4+ T cells, CD8+ T cells, and CD4+Foxp3+ cells in spleens or TILs of tumor-bearing mice. Mice (n = 3) were sacrificed when tumor sizes reached nearly 1,000–1,500 mm3. (A–F) Splenocytes isolated from the control, DTT-SP4-treated, or DTSP-treated group were divided into two tubes at 1 × 10⁶ cells/tube and then stained. One tube was stained with anti-CD4-FITC, anti-CD8-PE, and anti-CD3-PercP5.5 antibodies. The other tube was stained with anti-CD4-FITC and anti-CD3-APC antibodies and further stained with anti-Foxp3-PE antibody after fixation and permeabilization. (A) The proportion of CD8+/CD3+ T cells. (B) The proportion of CD4+/CD3+ T cells. (C) Ratios of CD8+ T cells to CD4+ T cells. (D) The proportion of Foxp3+/CD4+ T cells. (E,F) Freshly isolated TILs were divided into two tubes with 1 × 10⁶ cells/tube and then stained following the procedure followed for splenocyte staining. (E) The proportion of CD8+CD3+ T cells. (F) The percentage of Foxp3+ CD4+ T cells. Data are presented as means ± SD. *p < 0.05, **p < 0.01, ns, not significant, Student's t-test.

