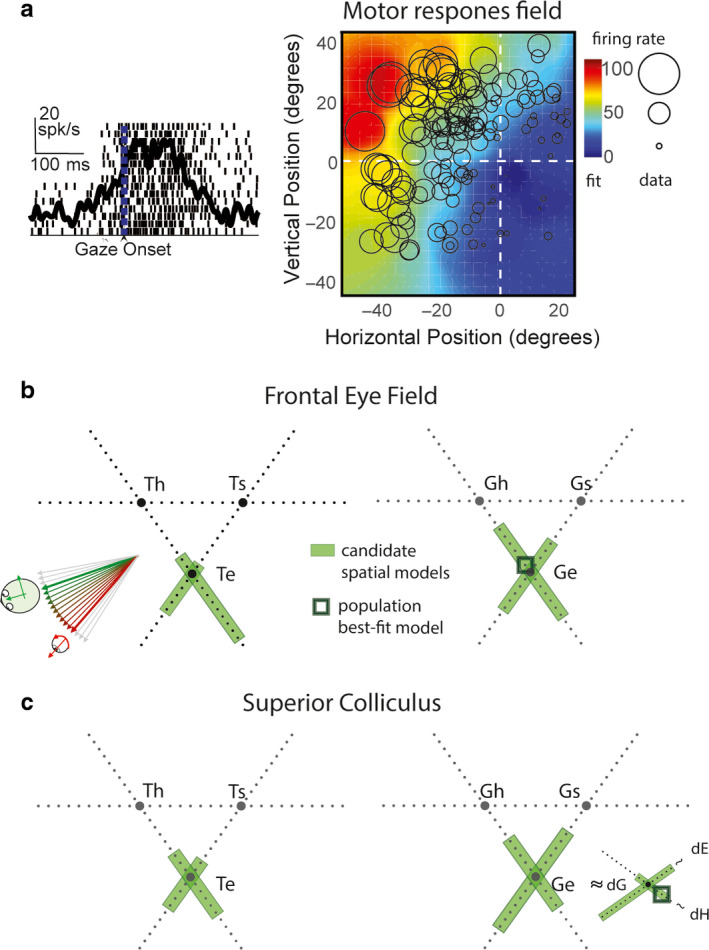
FIGURE 5.

Spatial analysis of motor response fields in FEF and SC. (a) Raster and spike density function aligned on gaze onset (left) and the motor response field plot (right) of a representative FEF motor response. Similar conventions as Figure 4a. (b and c) Spatial analysis of motor response fields of FEF (b) and SC (c) neurons. Similar conventions as Figure 4b,c are used. Motor response was sampled from the entire motor response (Figure 1b). Notice that noneliminated intermediate models (green shades) cluster around eye‐centered T (Te) and G (Ge) models. The population best‐fit for FEF motor activity was an intermediate spatial model close to Ge, and for SC motor activity was an intermediate model close to dG (gaze displacement), which is geometrically very similar to Ge. Adapted from Sajad et al., (2015) and Sadeh et al., (2015)
