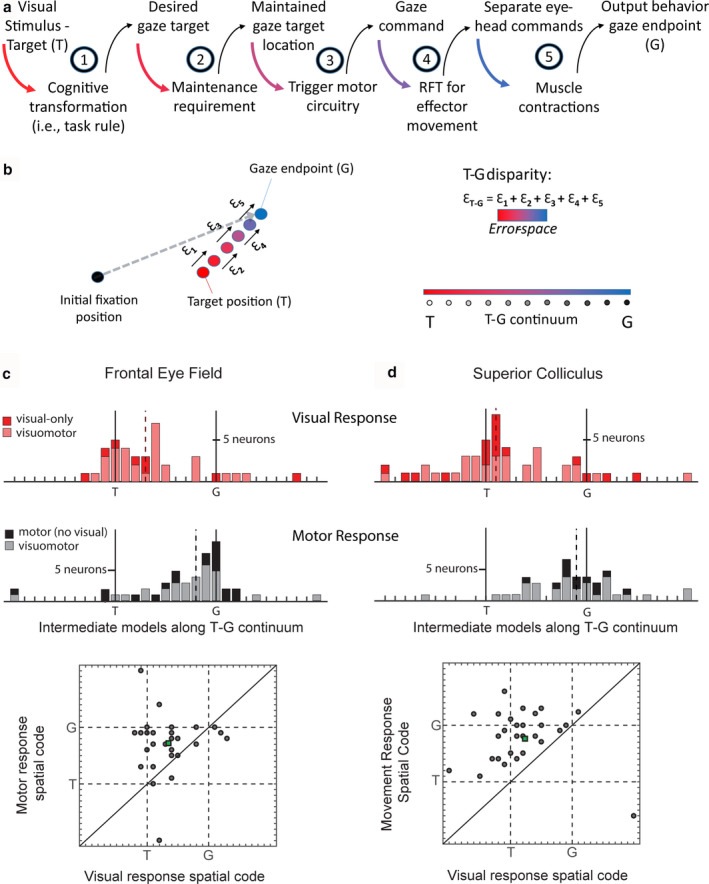
FIGURE 6.

Visuomotor transformations in FEF and SC between visual and motor responses in memory‐guided gaze task. (a) Breakdown of stages in the transformation from target sensory information to output gaze behavior. (b) Red dot: location of the visual target (T); Each process can incrementally add to inaccuracies in spatial representation of target (Ɛ1‐5) resulting in inaccuracy in gaze behavior (gray dotted arrow: gaze vector; blue dot: gaze endpoint). We constructed the T‐G continuum by dividing the error‐space (i.e., T‐G disparity) into equal intervals. This allowed us to explicitly test whether neural activity prefers intermediary positions along this error‐space. Distribution of best‐fit model along the T‐G continuum for visually responsive neurons (c and d top panels) and motor‐responsive neurons (c and d, middle panels). FEF and SC visual responses were sampled as indicated in Figure 1b. Note: visuomotor neurons (pink, c and d top, and gray, c and d bottom) appear on both upper and lower panels. Scatter plots show the best‐fit model distribution of motor response (y‐axis) versus visual response (x‐axis) for individual Visuomotor neurons. Deviation from line of unity indicates change in spatial code along T‐G continuum between visual and motor response in Visuomotor neurons. Adapted from Sajad et al., (2015) and Sadeh et al., (2015)
