
Fig 4.
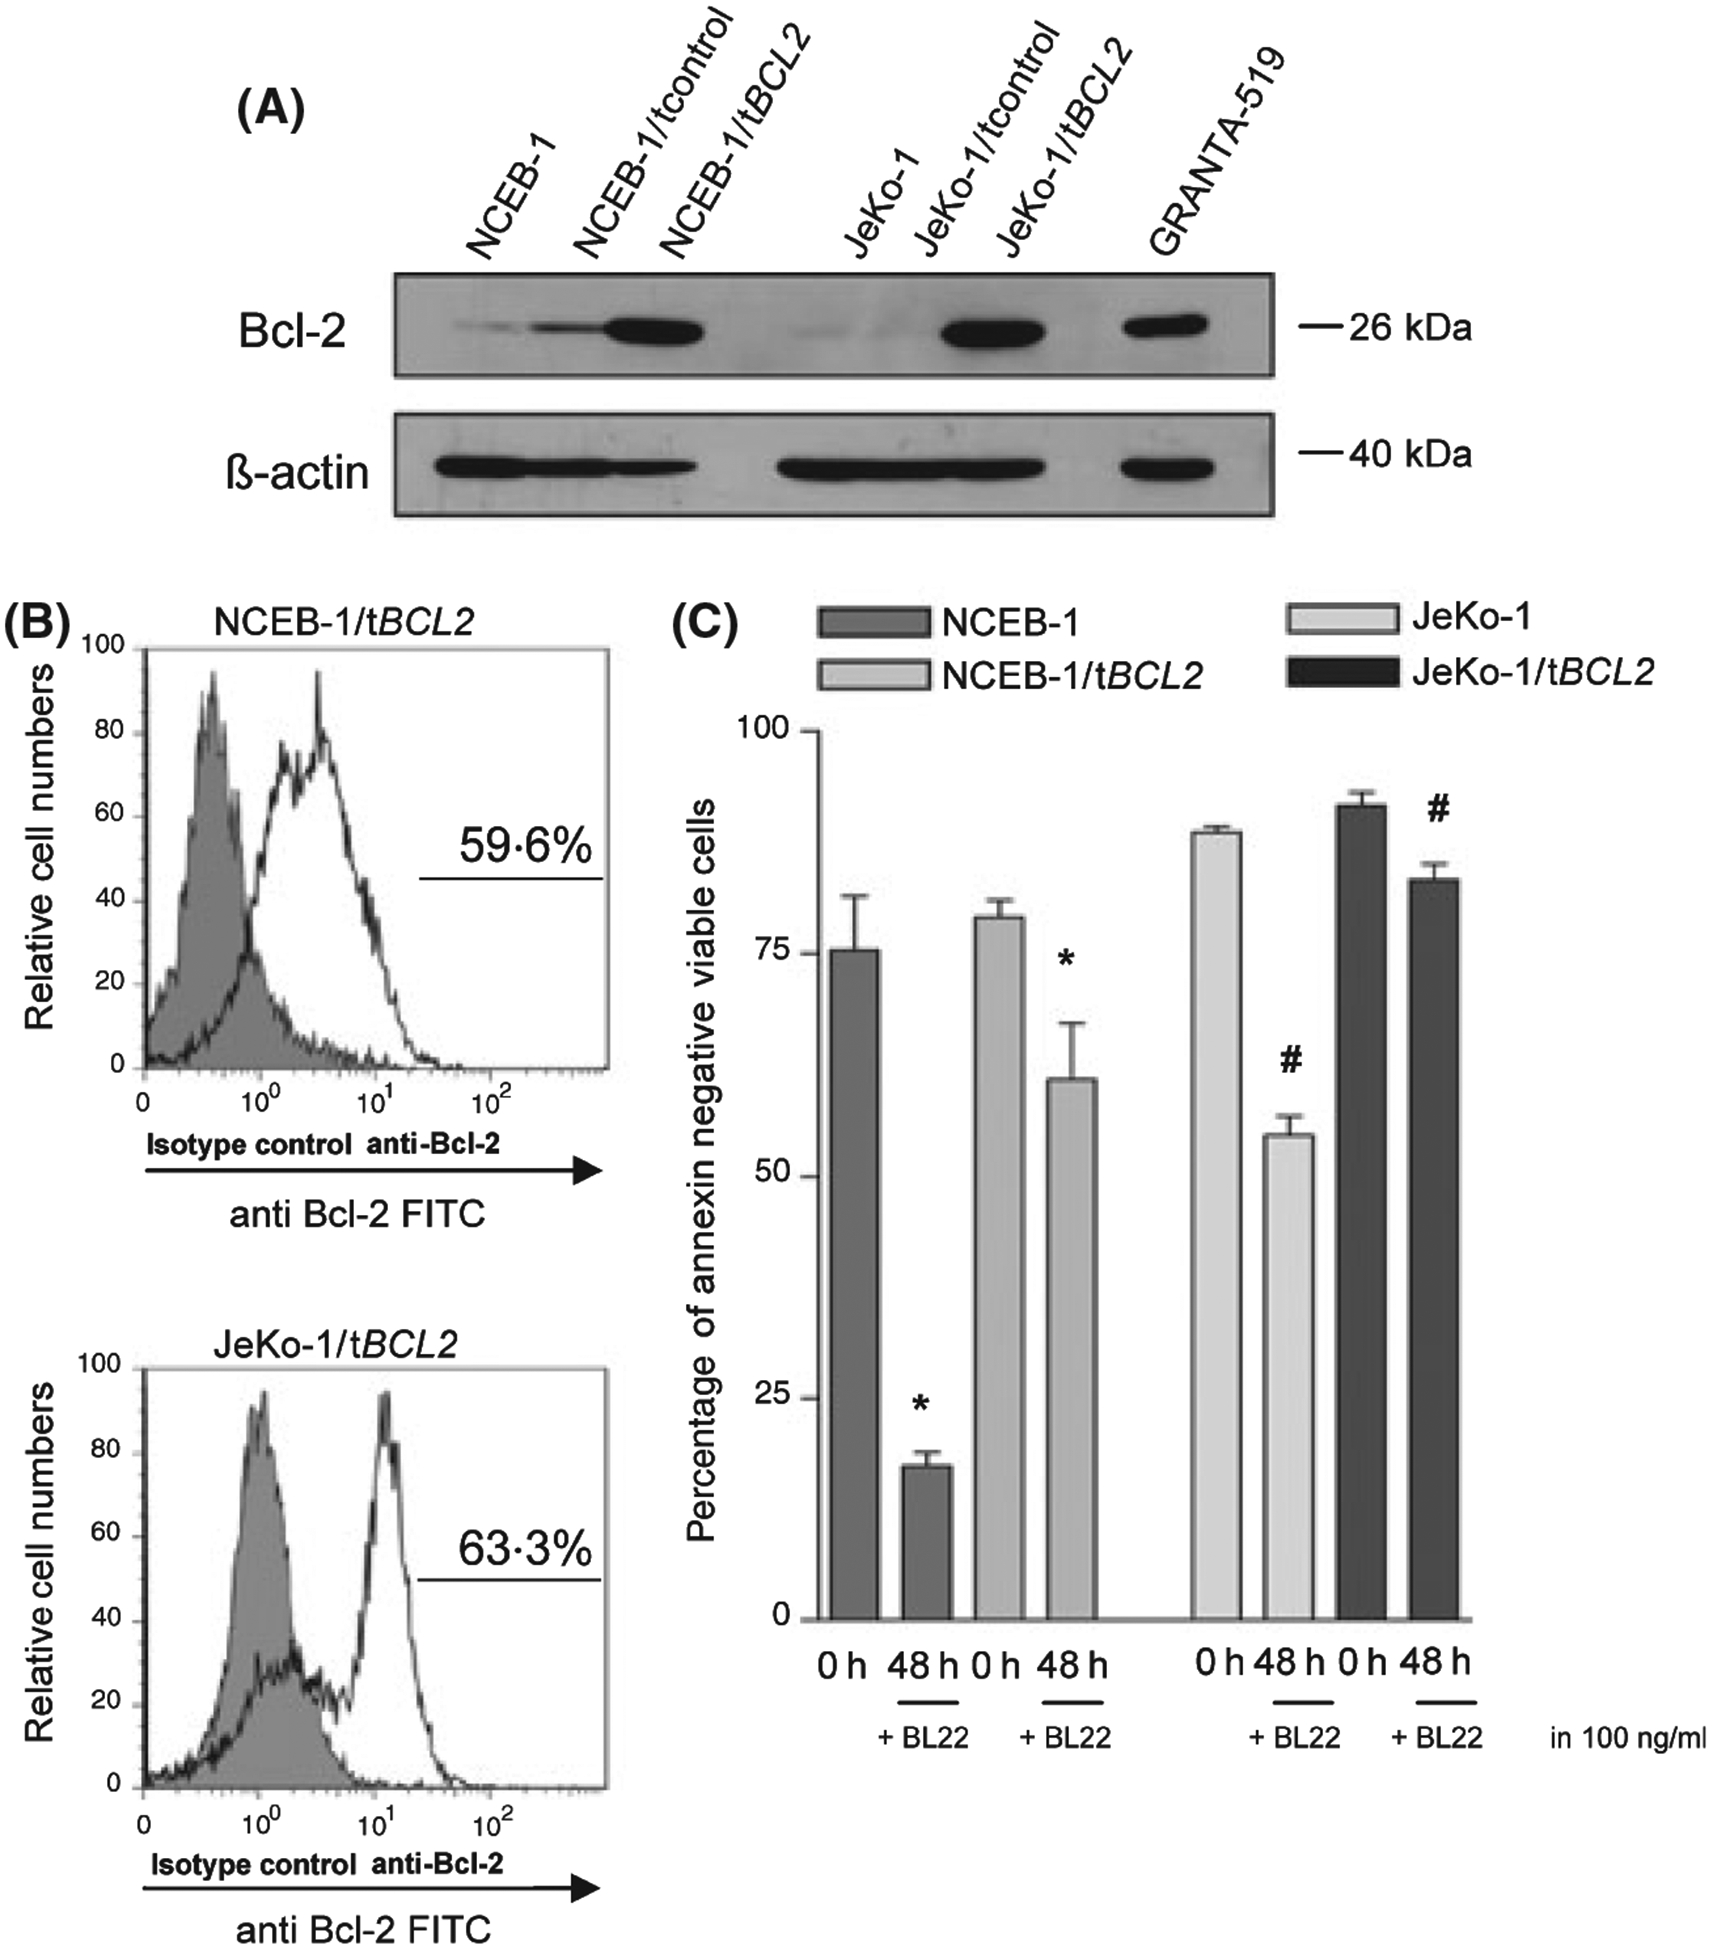
(A) Representative Bcl-2 immunoblot of GRANTA-519 cells (positive control), NCEB-1 cells, control or BCL2 cDNA transfected NCEB-1 cells as well as JeKo-1 cells, control and BCL2 cDNA transfected JeKo-1 cells. Anti β-actin blotting was used as loading control. (B) Flow cytometric Bcl-2 detection in BCL-2 transfected NCEB-1 cells (59·6%) and BCL-2 transfected JeKo-1 cells (63·3%). (C) NCEB-1, NCEB-1/tBCL2 cells as well as JeKo-1 and JeKo-1/tBCL2 cells were cultured in the presence of BL22 at the indicated concentrations for 48 h. Phosphatidylserine exposure was measured using the annexin V assay. The mean percentage of viable cells (annexin – and PI- negative) ± SEM of three different experiments is shown. Paired t-tests were performed to test for differences between NCEB-1 and NCEB-1/tBCL2 cells (*) and JeKo-1 and JeKo-1/tBCL2 cells (#). */# indicates when the difference between the cells was statistically significant (P < 0·05) (*: P 0·0217), (#: P 0·0175).