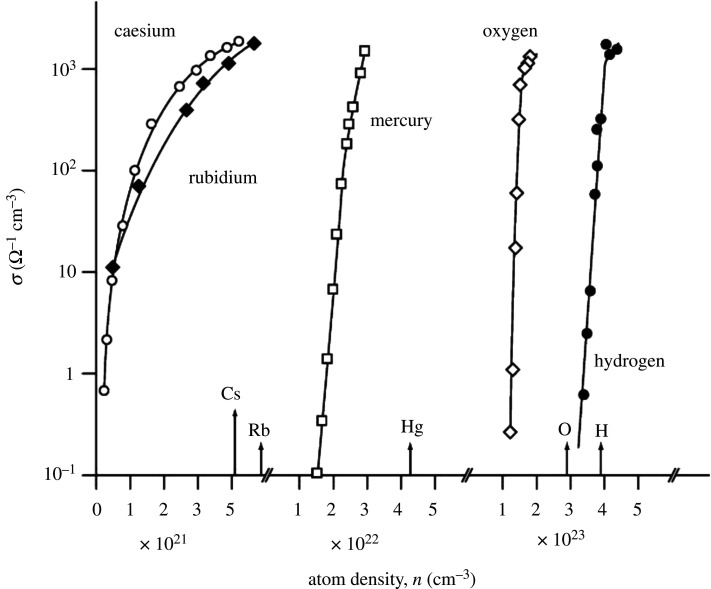
Figure 10.
The electrical conductivity of fluid caesium, rubidium, mercury, oxygen and hydrogen versus atom density. The tag lines on the atom density axis denote the predicted metallization densities for each element, based on the Goldhammer–Herzfeld model (see text). Note that the experimented atom densities range from 1021 cm−3 for caesium and rubidium to over 1023 cm−3 for oxygen and hydrogen (taken from [11]).

