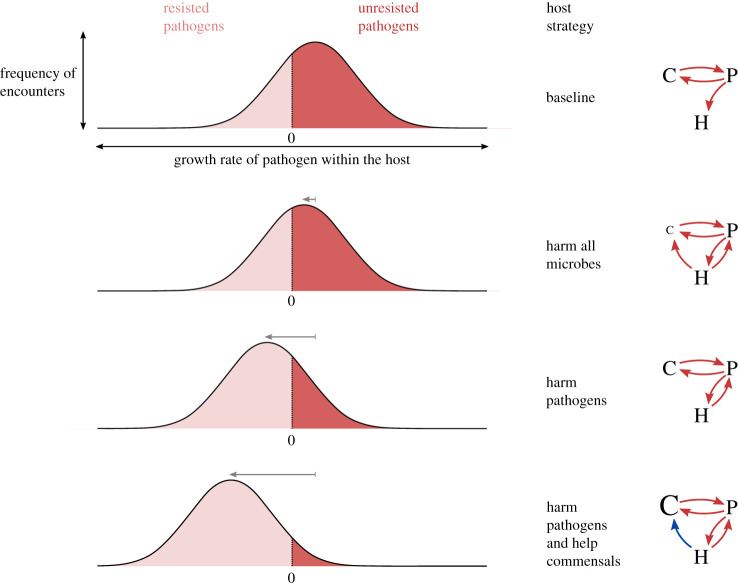
Figure 2.
A conceptual model of selection for cooperative immunity. Hosts encounter random pathogens with varied innate infectivities, which we represent by a distribution of exponential growth rate across pathogens. Encountered pathogens with positive growth rates successfully infect the host and those with negative growth rates are resisted. Host fitness increases when the fraction of unresisted pathogen encounters (dark red area under the curve) is reduced. Each row illustrates a different host defence strategy, illustrated by the arrow diagrams, in which red arrows denote direct harm and blue arrows denote direct help between host (H), commensal (C) and pathogen (P). Grey arrows indicate the shift in the peak of the distribution of pathogen growth rates from baseline caused by the given strategy. Row 1: As a baseline, we consider a host that is colonized by commensals that compete with its pathogens. Row 2: A host strategy that harms commensals and pathogens equally reduces the competition experienced by pathogens and so has a limited net impact on pathogen growth rates. Row 3: Selectively harming pathogens maintains competition from commensals and so provides a greater reduction in pathogen growth rates than harming all microbes. Row 4: Additionally helping commensals increases the competition from commensals and thus further decreases pathogen growth rates. The host may also have a fixed set of baseline antimicrobial defences common to all strategies, which we do not represent in the arrow diagrams.

