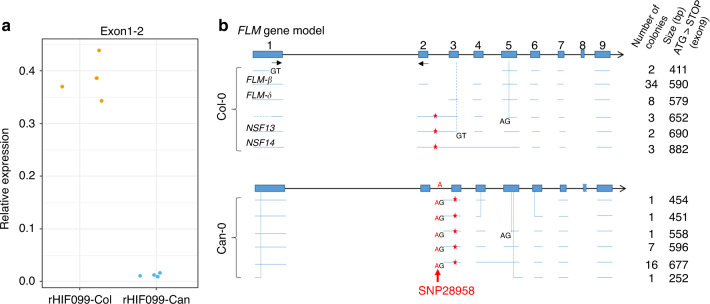
Fig. 2. FLM transcripts characterization in Can-0 and Col-0.
a Transcript accumulation was measured by qRT-PCR in rosette leaves grown on the Phenoscope from rHIF099 homozygous for the Can or the Col allele, using primers located in exon1 and exon2 of FLM (qFLM-F3 + qFLM-R3b), represented by black arrows in b. Each dot represents the mean of a technical duplicate from an individual plant. b PCR products of the FLM coding region of Col-0 and Can-0 (from the start to the stop codons) were used for subcloning and the colonies obtained were screened by PCR to estimate the size of many subcloned fragments. Plasmids of one or two colonies carrying a PCR product with a distinct band size were sent for Sanger sequencing. This provided the sequences illustrated here with the horizontal blue lines. An estimate of the frequency of each isoform sequenced is given according to the size of the PCR product obtained during the colony screening. The vertical dashed lines specify a discrepancy between the annotation and the isoform sequenced. New donor (GT) and acceptor (AG) splice site are depicted when present. Red stars represent premature stop codon. In Col-0, FLM-β as well as variants previously identified38,39 are mentioned (FLM-δ, NSF13, and NSF14). The candidate polymorphism responsible for the splicing shift observed in most of the FLM-Can transcripts is depicted in red (“SNP28958”). Source data underlying Fig. 2a are provided as a Source Data file.

