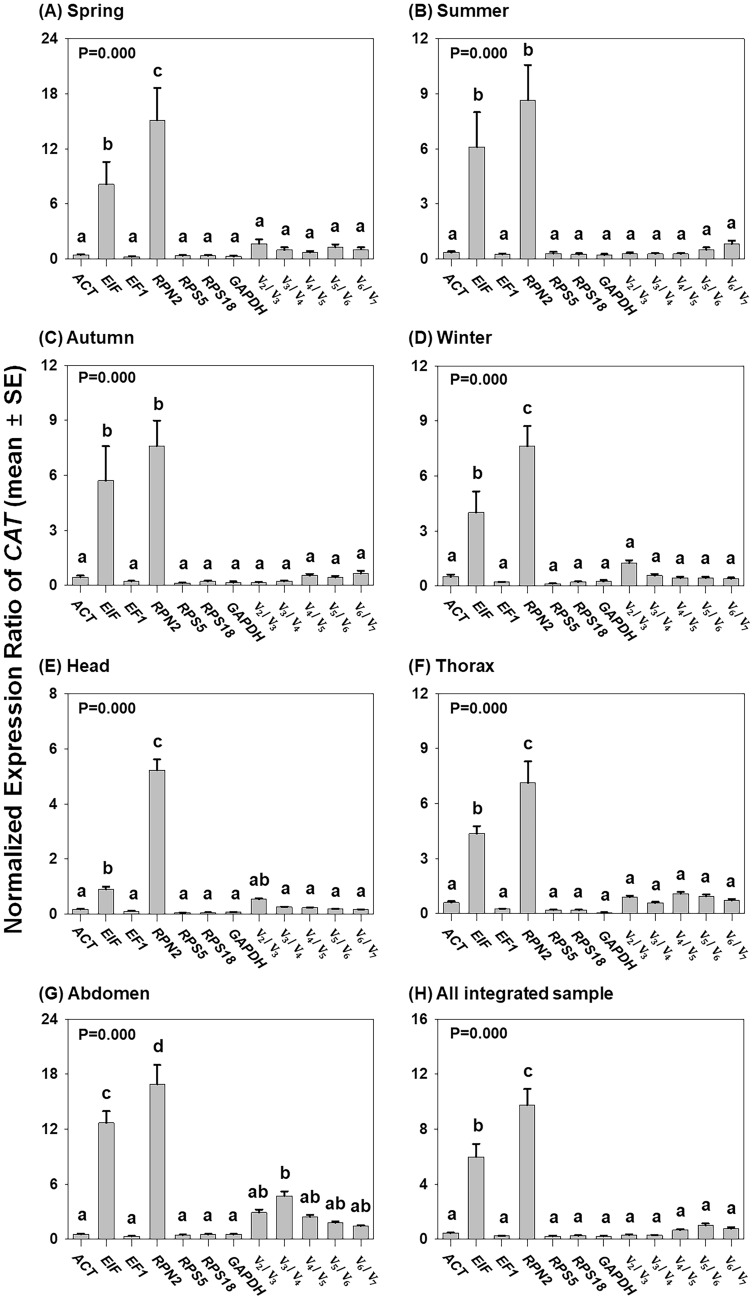
Figure 5.
Comparison of expression levels of CAT in honey bee samples normalised with a single gene from the seven references and a combination of multiple reference genes. Samples were prepared from four seasons (A–D), three tissue types (E–G) and the integration of all samples (H). The expression levels of CAT normalised with different methods were statistically analysed with a one-way ANOVA followed by Tukey’s multiple comparison post-hoc test and different letters indicate significantly different values (P < 0.05). Data are presented as mean values ± SE.

