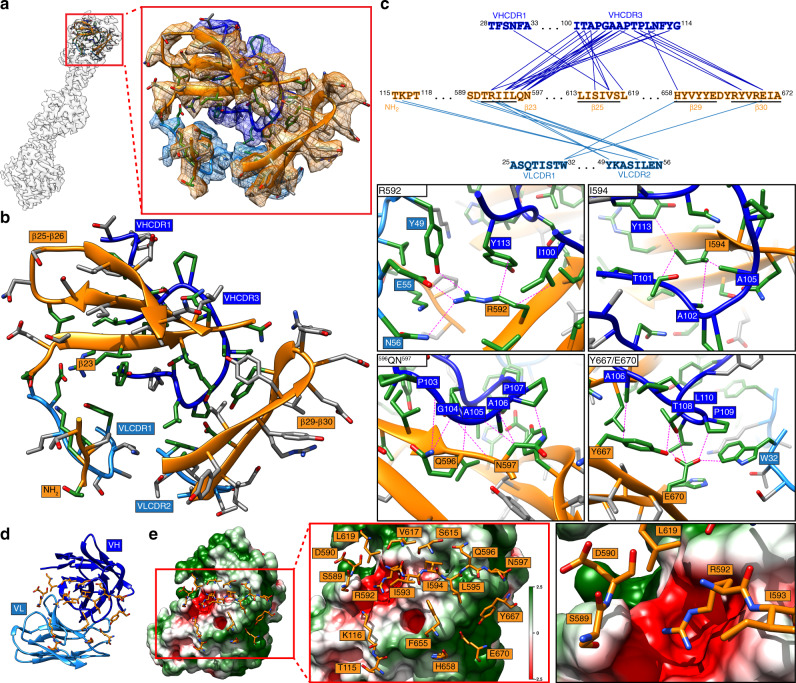
Fig. 4. Molecular interactions at the VZV gB-93k interface.
a Location in the 2.8-Å cryo-EM map and extracted densities of one gB protomer in complex with a 93k Fab fragment. The zoomed in panel shows the extracted densities at the gB-93k interface. b, c Representative scenes from Supplementary Movie 3. b Ribbon diagram of the amino acids from the extracted density at the gB-93k interface (a). Those highlighted in green represent interacting amino acids. The β23, β25-26, β29-30, and the NH2 terminus of gB are highlighted with orange boxes, and the VHCDR1, VHCDR3, VLCDR1, and VLCDR2 are highlighted by blue boxes; VH – dark blue, VL – light blue. c Molecular interactions between gB and the VH and VL chains of mAb 93k. The upper panel shows a linear map of the interactions (blue lines) between gB residues in β23, β25, β29, and β30 with those in VHCDR1, VHCDR3, VLCDR1, and VHCDR2 (not shown in Supplementary Movie 3). Underlined amino acids represent beta strands. The four lower panels show the interactions between gB residues R592, I594, 596QN597, and Y667/E670D with mAb 93k. Dotted lines (magenta) represent molecular interactions calculated using Find Contacts (Chimera, Supplementary Data 1). All interactions are shown in Supplementary Movie 3. d, e Orientations are equivalent to B. d The mAb 93k VH (blue) and VL (light blue) chains with gB interacting amino acid side chains (orange). e Surface electrostatic potential of the mAb 93k Fab VH and VL chains (calculated using APBS; Adaptive Poisson-Boltzmann Solver69) and zoomed in (middle and right panels) to highlight the gB interface residues represented in stick format (orange), which are scenes from Supplementary Movie 4. The potentials are on a red–white–green color map (−2.5 to 2.5) in units of kJ/mol/e.

