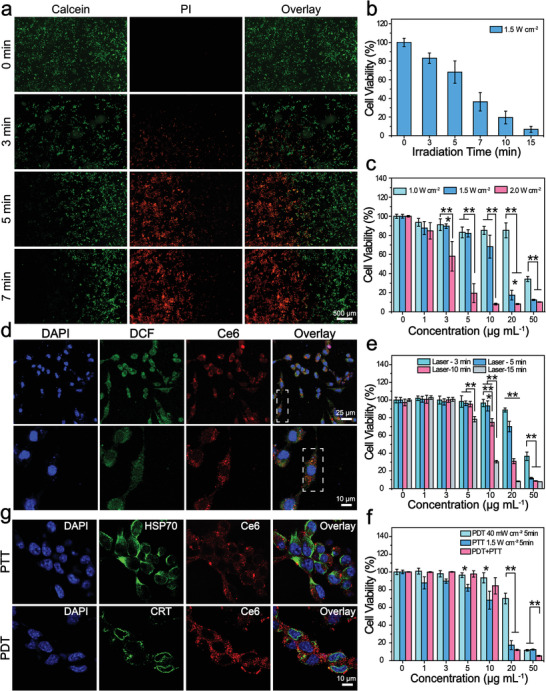
Figure 2.

Phototherapeutic effects and immunological responses induced by phototherapy in vitro. a,b) Cell viability of 4T1 cells incubated with Gd‐Ce6@SWNHs (10 µg mL−1) after PTT with an 808 nm laser (1.5 W cm−2) for 3, 5, or 7 min. Cell viability imaging by fluorescence microscopy after staining with the live‐dead cell staining kit (Calcein‐AM/PI) (a) and quantified by CCK‐8 assay (b). c) Cell viability of 4T1 cells incubated with Gd‐Ce6@SWNHs at different concentrations and illuminated under an 808 nm laser for 5 min at different density (1.0, 1.5, and 2 W cm−2). d,e) PDT applied to Gd‐Ce6@SWNHs treated 4T1 cells. d) Detection of intracellular singlet oxygen of 4T1 cells treated with Gd‐Ce6@SWNHs (10 µg mL−1) for 12 h and illuminated with a 650 nm laser for 5 min at the density of 40 mW cm−2 (upper row). Magnified images of selected regions from (d) to perceptibly locate the nanovehicles and intracellular reactive oxygen (lower row). e) Cell viability of 4T1 cells incubated with Gd‐Ce6@SWNHs at different concentrations (1, 3, 5, 10, 20, and 50 µg mL−1) and illuminated with a 650 nm laser for various time intervals (3, 5, 10, and 15 min) at the density of 40 mW cm−2. f) PDT and PTT sequential therapy of 4T1 cells treated with Gd‐Ce6@SWNHs and illuminated with a 650 nm at the density of 40 mW cm−2 and subsequently under an 808 nm at the density of 1.5 W cm−2 for 5 min. g) Immunofluorescence staining of HSP 70 and CRT as a consequence of immunogenic cell death (ICD) mediated by PTT or PDT. All values are expressed as mean ± SD. Statistical significance (p) was calculated by one‐way analysis of variance (ANOVA) using the Tukey′s post‐test; p‐value: *p < 0.05; **p < 0.01.
