Figure 2.

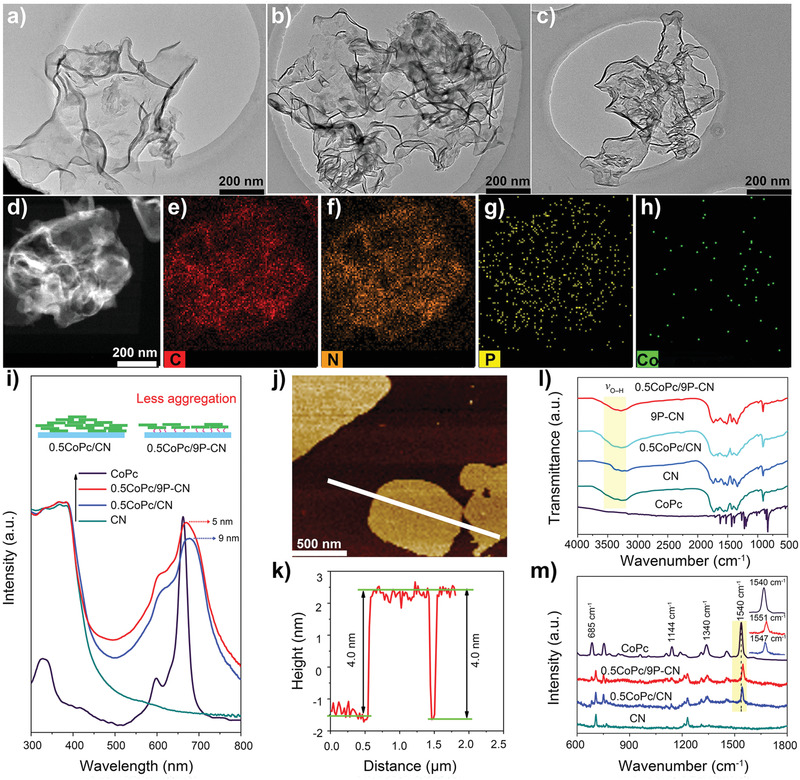
TEM images of a) CN, b) 0.5CoPc/CN, and c) 0.5CoPc/9P‐CN, respectively. d) HAADF‐STEM image of 0.5CoPc/9P‐CN and e–h) the corresponding EDX mapping images of elemental C, N, P, and Co. i) UV–vis absorption spectra of CoPc, CN, 0.5CoPc/CN, and 0.5CoPc/9P‐CN, respectively. j) AFM image and k) the corresponding height profiles of 0.5CoPc/9P‐CN. l) Normalized FT‐IR and m) Raman spectra of CoPc, CN, 0.5CoPc/CN, and 0.5CoPc/9P‐CN, respectively.
