Figure 2.

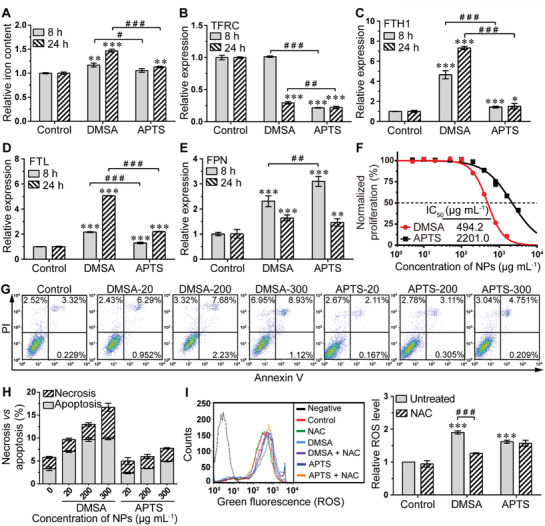
Intracellular soluble iron retention resulted in excess ROS and enhanced a higher cellular vulnerability with increased cell death in SK‐Hep‐1 cells. A) The iron content at 8 and 24 h after exposure to 300 µg mL−1 Fe2O3@DMSA or Fe2O3@APTS. The data represented mean ± SD. **p < 0.01 and ***p < 0.001 compared with control. # p < 0.05 and ### p < 0.001 between the indicated groups. B–E) The mRNA expression levels of typical iron transport systems including TFRC, FTH1, FTL, and FPN in SK‐Hep‐1 cells exposed to 300 µg mL−1 Fe2O3@DMSA or Fe2O3@APTS. The data represented mean ± SD. *p < 0.05, **p < 0.01, and ***p < 0.001 compared with control. ## p < 0.01 and ### p < 0.001 between the indicated groups. F) Relative cell proliferation rate of SK‐Hep‐1 cells exposed to gradient concentrations of Fe2O3@DMSA or Fe2O3@APTS. The data represented mean ± SD. G,H) Apoptosis and necrosis of SK‐Hep‐1 cells exposed to 20, 200, or 300 µg mL−1 Fe2O3@DMSA or Fe2O3@APTS. I) Intracellular ROS production of SK‐Hep‐1 cells exposed to 300 µg mL−1 Fe2O3@DMSA or Fe2O3@APTS with or without NAC for 24 h. The data represented mean ± SD. ***p < 0.001 compared with control. ### p < 0.001 between the indicated groups. DMSA denotes Fe2O3@DMSA. APTS denotes Fe2O3@APTS.
