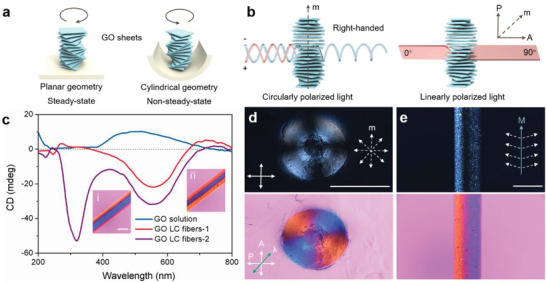
Figure 2.

3D topological configurations within GOLC fibers. a) Schematic illustration showing a left‐handed GO cholesteric order in a stable planar geometry and a right‐handed GO cholesteric order in a dynamic cylindrical geometry. b) Schematic illustration showing the light path change of circularly and linearly polarized light through a right‐handed cholesteric GOLC order. c) CD spectra of GO solution (0.2 wt%), GOLC fibers‐1 and GOLC fibers‐2 obtained at the ejected speed of 0.5 mL min−1 and 2 mL min−1, respectively. Inset in c: (i) POM‐λ image of the GOLC fibers‐1 and (ii) POM‐λ image of the GOLC fibers‐2. Scale bars, 500 µm. d) POM image of the radial section of GOLC fibers with a Maltese cross pattern, and corresponding POM‐λ images with an alternating red and blue Maltese cross pattern. Inset in d: radial cholesteric axis field schematic. (arrow P, A, and λ represent the axis of the polarizer, analyzer, and λ plate, respectively). e) POM image showing a bright‐dark‐bright fringe along the axial direction of GOLC fibers, and corresponding POM‐λ images with an axial red‐blue fringe. Inset in e: an awl‐shaped cholesteric axis field schematic (m represents the direction of the axis of GO cholesteric order, M represents the axis of GOLC fibers). Scale bars, 500 µm.
