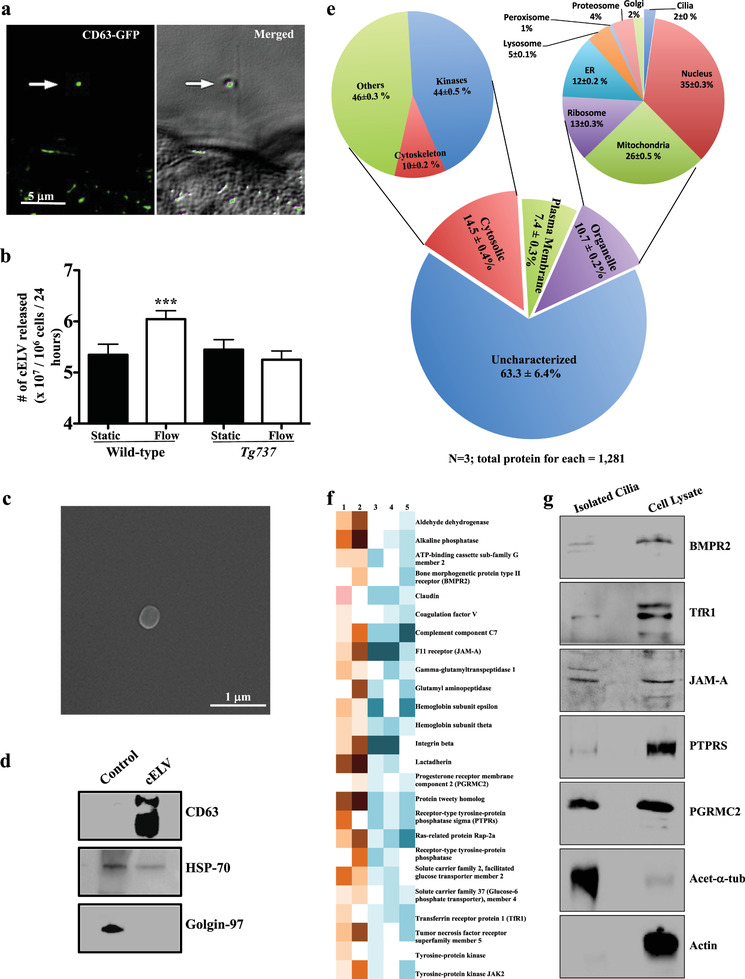
Figure 1.

Proteomic identification of cELV proteins. a) CD63‐GFP was localized in the cELV (arrow; Movie S4, Supporting Information). The cELV can be seen in the differential interference contrast (DIC) image. CD63‐GFP localization to cELV at different time points is shown in Figure S2c (Supporting Information). b) Fluid shear stress (1 dyn cm−2 for 30 min) induced the release of cELV in cells with cilia (wild‐type) but not in those without cilia (Tg737). The release of the cELV from a cilium can be seen in Movie S4 (Supporting Information). c) After fluid flow, CD63‐GFP vesicles were isolated from the eluent. A scanning electron microscopy (SEM) image of a single CD63‐GFP vesicle is shown. Isolation and purification are shown in Figure S2 (Supporting Information). d) Purity of CD63‐GFP vesicles was further verified by immunoblotting for CD63 and HSP70 (positive controls) and Golgin‐97 (negative control). e) Based on the micro MudPIT separation, a comparative proteomic analysis between isolated primary cilia (with induced cELV appearance) and whole cell lysates, indicated that 2% of all organellar proteins were localized within the cilia (and cELV). About 18.5% of all these cELV proteins have been previously confirmed to be in the cilia (Table S2, Supporting Information). Proteomic analysis using a standard MudPIT separation was also performed (Figure S8f, Supporting Information). f) A representative heat‐map image shows the newly identified ciliary proteins that consistently appeared in all MudPIT samples. The relative abundance of each protein is indicated in orange (high abundance; samples 1 and 2) and blue (low abundance; samples 3, 4, and 5). g) A western blot analysis confirmed the expression of all five selected ciliary proteins. Acetylated α‐tubulin and actin were used as controls to indicate the purity of isolated cilia. N = 3 in each group. ***, p < 0.001.
