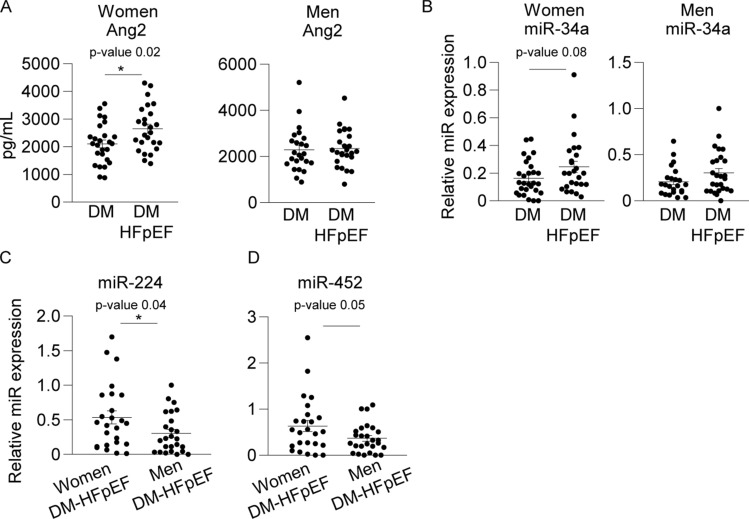
Figure 3.
Plasma Ang-2 levels and plasma miR-34a, -224 and -452 in (female) DM patients with HFpEF. (A) Increased plasma Ang-2 (Fold change 1.3, p = 0.02, 95% CI 110.5–980.9) levels in diabetic women with HFpEF compared to diabetic women without HFpEF (but not in diabetic HFpEF men compared to diabetic men without HFpEF), (B) miR-34a displayed a trend towards an increase in diabetic women with HFpEF compared to diabetic women without HFpEF only (Fold change 1.5, p = 0.08, 95% CI − 0.009 to 0.173). (C) Increased plasma levels of miR-224 (Fold change 0.57, p = 0.04, 95% CI − 0.452 to − 0.010) and (D) miR-452 (Fold change 0.58, p = 0.05, − 0.539 to − 0.002) in diabetic women with HFpEF compared to diabetic men with HFpEF. Relative miR expression values are normalized to plasma miR-16 levels, presented as mean ± standard error of the mean (SEM) and group differences are depicted as *p ≤ 0.05 according to a student T-test.

