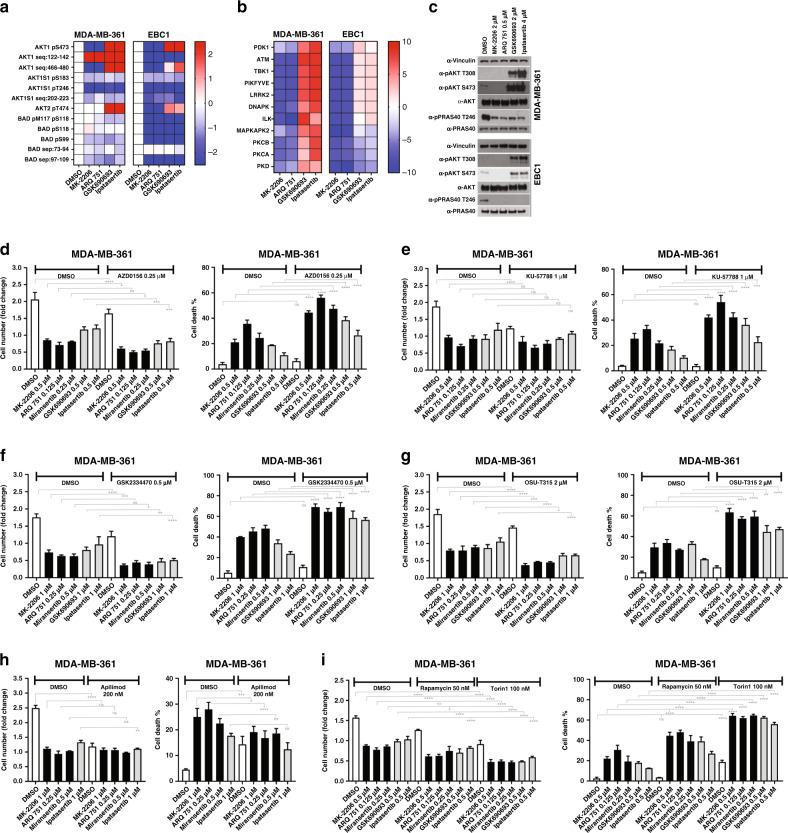
Fig. 4. Phosphoproteomic signatures of AKT inhibitors uncover potential therapeutic co-targets.
a MDA-MB-361 and EBC1 cells were treated with the indicated drugs for 6 h and lysed. Lysates were subjected to phosphopeptide enrichment, and analysed by quantitative LC-MS/MS. Shown are the quantification of mass spectra corresponding to known AKT substrates. b Phosphoproteomic data was analysed by kinase substrate enrichment analysis (KSEA). Shown are all kinases predicted to be associated with the observed phosphopeptide signatures, that were affected differently by each inhibitor class (i.e. ATP-competitive vs allosteric) but similarly by both inhibitors of the same class in at least one of the cell lines. c Lysates from a, b were also subjected to immunoblot to further document drug activity using the indicated antibodies. d–g MDA-MB-361 cells were treated with various AKT inhibitors either alone or in combination with the ATM inhibitor AZD0156 (d), the DNA-PK inhibitor KU-57788 (e), the PDK1 inhibitor GSK2334470 (f), or the ILK inhibitor OSU-T315 (g). h, i MDA-MB-361 cells were also treated with various AKT inhibitors either alone or in combination with the PIKFYVE inhibitor apilimod (h), or the mTORC inhibitors rapamycin or torin1 (i) at the indicated doses. The fold change in cell number and fraction of dead cells following 4 days of drug treatment is shown (cell death %). n.s., not significant. *P ≤ 0.05, **P ≤ 0.01, ***P ≤ 0.001 and ****P ≤ 0.0001.

