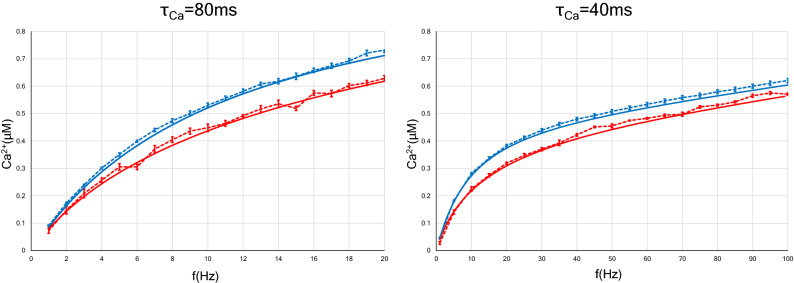
Figure 3.
Relation between the postsynaptic calcium concentration and the average frequency of presynaptic constant-ISI (or Poisson) input. As in Fig. 1, two types of neurons with different calcium decay time constants were examined. The analytic solutions are shown with solid lines, whereas the results of numerical simulation are shown with dotted lines. The blue (or red) lines indicate the calcium concentration of the postsynapse with constant-ISI (or Poisson) input. In the case of Poisson input, the increase in calcium concentration with respect to the average frequency is slower than in the case of constant-ISI input. This result is independent of the calcium decay time constant. Error bars indicate the SEM.

