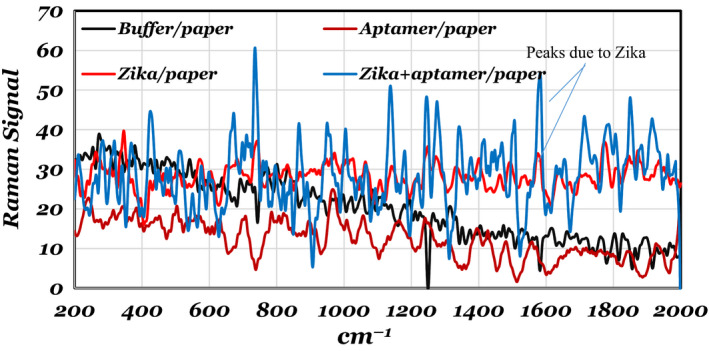
Figure 7.

Raman spectra of buffer/paper, aptamer/paper, Zika/paper and Zika/aptamer/paper. The spectra are normalized with dry paper Raman spectrum. These spectra clearly show the difference between aptamers, Zika and buffer deposited on the paper. [Colour figure can be viewed at wileyonlinelibrary.com]
