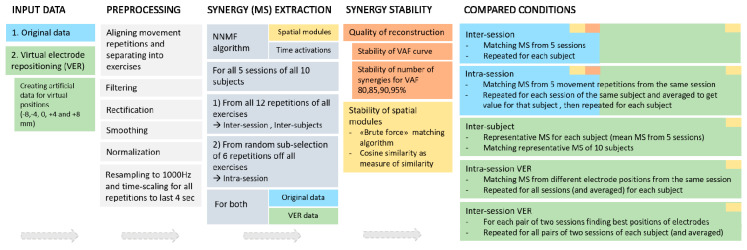
Figure 1.
Overview of the steps of the data analysis that were performed. Two groups of input data were used: for the first part of the analysis, the original data from the NinaPro database (light blue background color) were used to quantify the difference in variability between intra-session and inter-session conditions; for the second part of the analysis, the artificially created data (green) were used to quantify effects of electrode repositioning. Preprocessing (white) was followed by synergy extraction (light gray) as described in detail in the text for both original and simulated datasets. Synergy stability was assessed using two approaches: variability in the metrics for reconstruction (variance accounted for (VAF) and number of synergies (NoS), red) and, second, assessing similarity of spatial composition of synergies (yellow).

