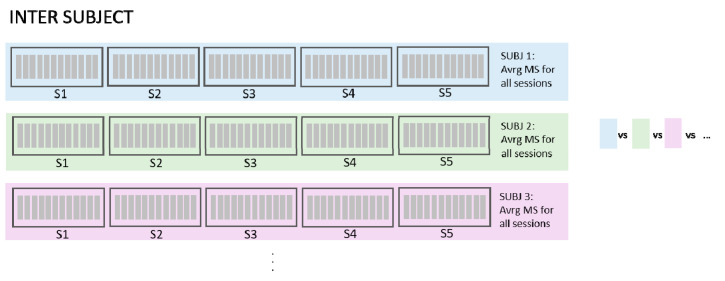
Figure 8.
Data structure and analysis steps used for inter-subject analysis: Synergies of all 5 session of each subject were extracted, optimally matched, and averaged to achieve representative synergies for each subject. Representative synergies were then compared (matched) between subjects. Inter-subject similarities were later compared with inter-session similarities in order to test generalization of synergies between subjects in Comp#5.

