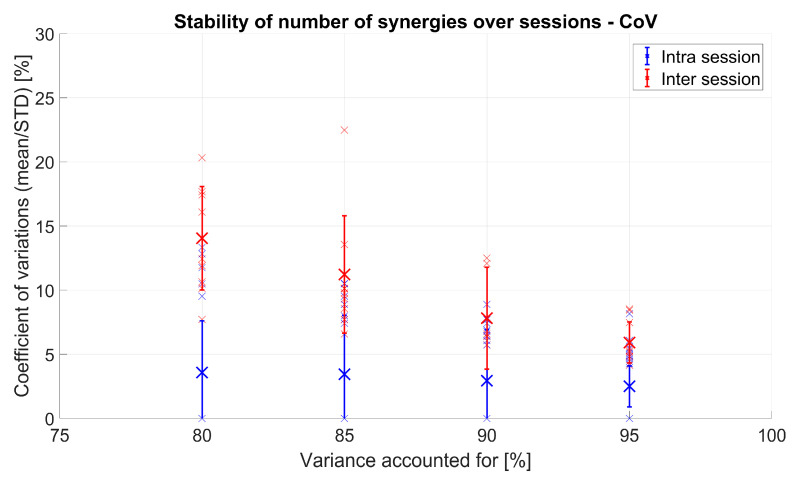
Figure 12.
Intra-session (blue) and inter-session (red) CoV of NoS values for 10 subjects: Inter-session was achieved by comparing NoS values between 5 sessions of each person, whereas intra-session was achieved by comparing NoS values for 5 different movement sub-selections inside the same session (and repeated and averaged for all sessions). Each small “x” represents one person, and the bigger “X” represents the mean of all 10 subjects.

