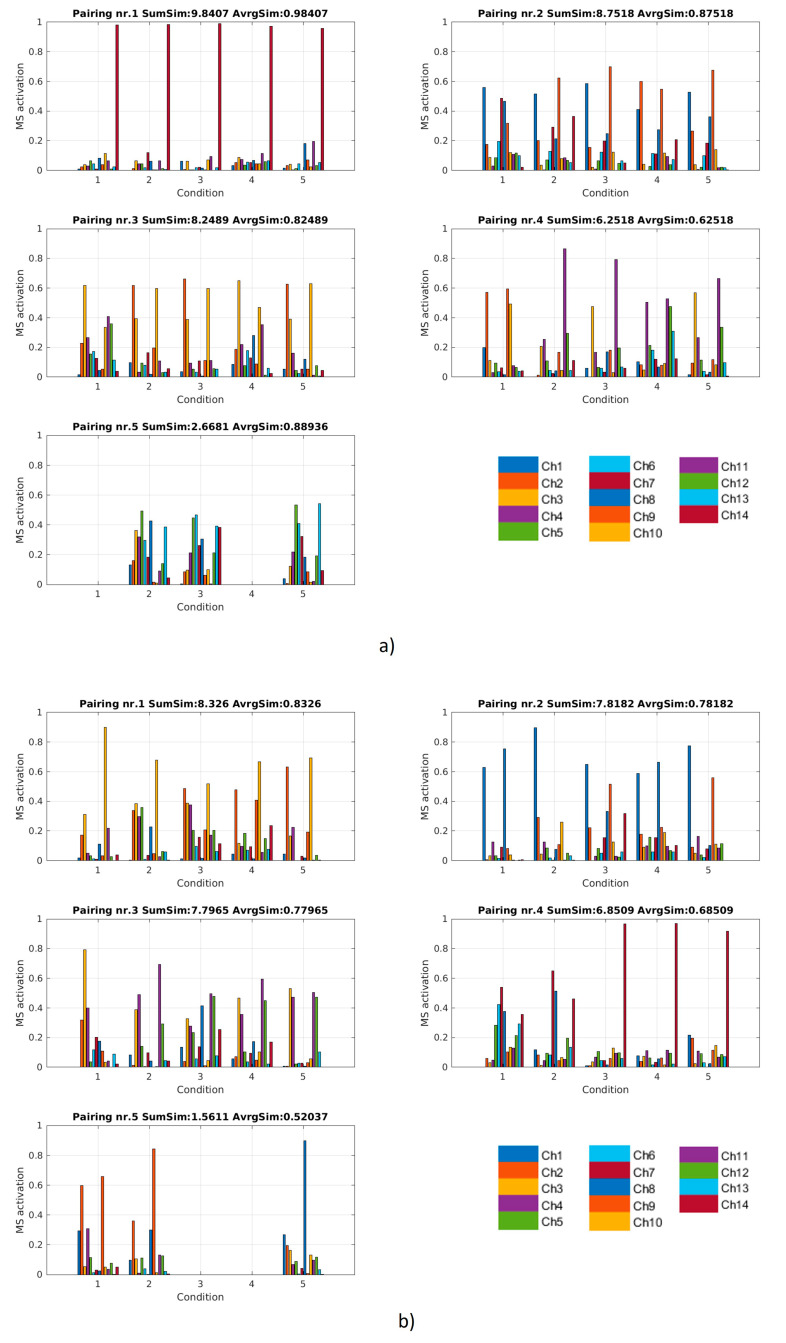
Figure 13.
A typical person with a high inter-session matching score (a) and lower inter-session matching score (b): In both cases, a VAF of 85% was considered. The X axis represents five sessions from which synergies were extracted. On the top-left graph, five synergies (one for each session) are shown and they represent a group of the five synergies with the highest similarity, chosen from the pool of synergies extracted for all five sessions. The groups of synergies in each subplot show the result of optimal matching of synergies. In the titles, the average similarity and the sum of all pairwise similarities in a given matching group (cluster) is reported. Clusters were sorted based on the sum of similarities (SumSim).

