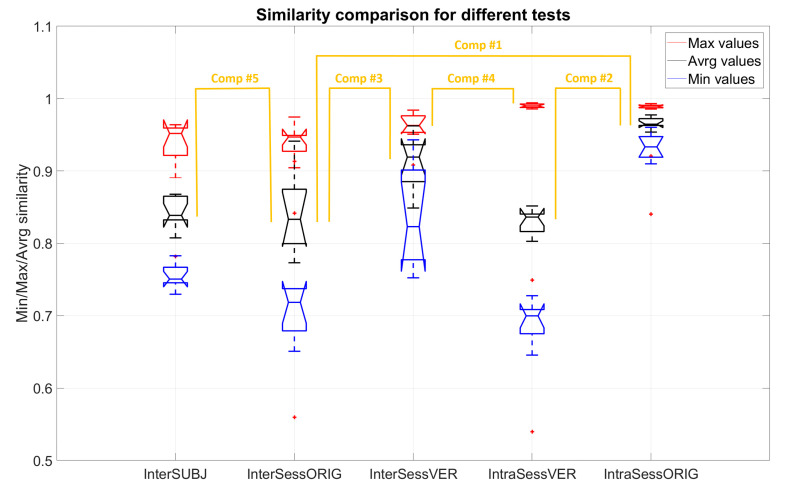
Figure 16.
Comparison of muscle synergy similarity with different analysis approaches: inter-session (InterSessORIG), intra-session with sub-selection (IntraSessORIG), intra- and inter-session with virtual electrode repositioning (IntraSessVER and InterSessVER), and inter-subject (InterSUBJ) for all 10 participants and VAF threshold = 80%. The X axis represents different tests as described above, and Y axis represents MIN (blue), MAX (red), or AVRG (black) values of similarities. The details of each test are reported in the text.

