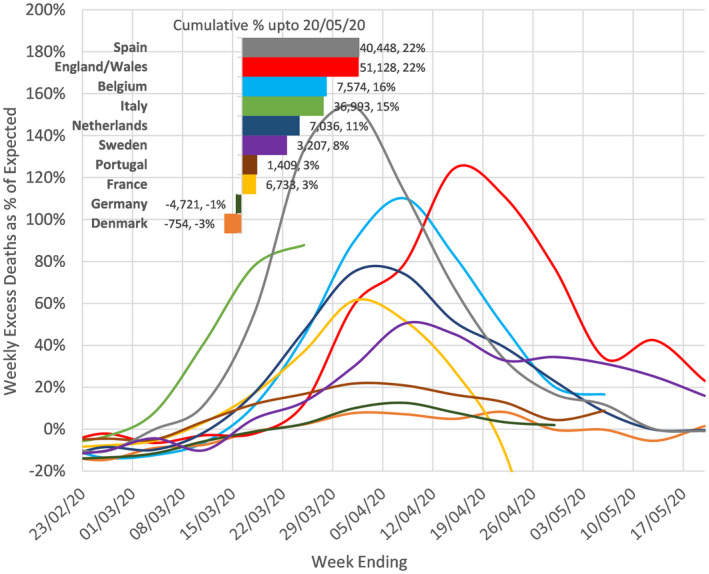
FIGURE 1.

Excess Deaths in weeks 8‐21 of 2020. Difference to average in the same week in the previous 3 years (2017/2018/2019) and shown as % of average. 50 Source: The Human Mortality Database Department of Demography at the University of California, Max Planck Institute for Demographic Research, Center on the Economics and Development of Aging (CEDA) www.mortality.org. 8 Downloaded 9/6/2020
