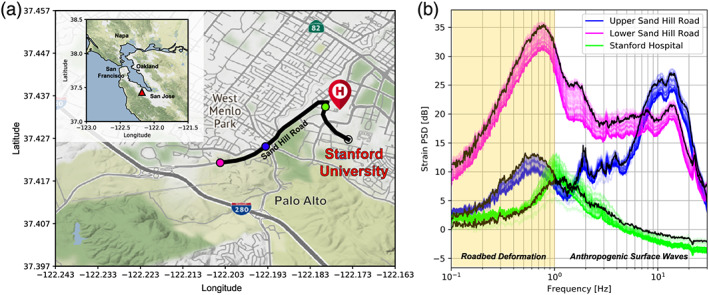
Figure 1.

Stanford DAS‐2 experiment Array and anthropogenic noise spectra. (a) Map of optical fiber path used for DAS (black line) located in Palo Alto, California (inset, red triangle). Circles color‐code a few DAS channels used for detailed analysis (white = quiet reference; green = near Stanford hospital; blue = upper Sand Hill Road; magenta = lower Sand Hill Road). (b) Daily median power spectral density (PSD) of strain data computed for DAS channels shown in (a) highlight strong spatial variability in anthropogenic ground motion, and how this ground motion changed during quarantine. Black curves represent PSD on 01 March 2020. Transparent colored curves fade to solid with increasing experiment date through end of April 2020 (magenta and blue both decrease; green does not show a clear trend). Yellow shading highlights frequency band used to identify vehicles with DAS based on their geodetic roadbed deformation.
