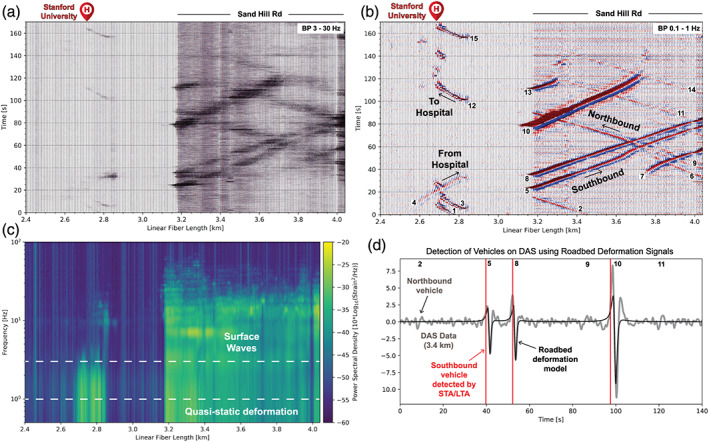
Figure 2.

Vehicle observations from Stanford DAS‐2 Experiment. (a) Example of DAS recordings bandpassed around 3–30 Hz showing vehicle surface waves and contrasting background energy between Stanford Hospital and Sand Hill Road sections. (b) Same as (a) but bandpassed around 0.1–1 Hz to highlight the high quality geodetic strain responses of the roadbed due to vehicle loading. Individual vehicles are numbered. (c) Continuous wavelet transform applied to spatial axis of unfiltered data shown in (a) and (b) highlighting dominant frequencies of different array segments. (d) Example processed strain data from DAS channel at 3.4 km, bandpass filtered as in (b) in gray, with a model of the horizontal strain for three vehicles passing the fiber on the southbound side of the road (black line), and three STA/LTA detections (red lines) for vehicles #5, #8, #10 shown in (b). A matched template algorithm was then applied using the median of approximately 200 detected vehicle signals and scanning over the full daily time series for the DAS channel.
