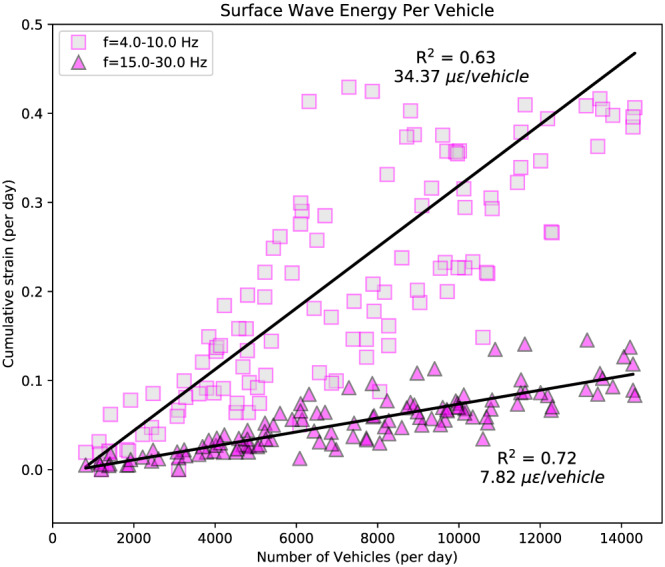
Figure 4.

Relationship between anthropogenic surface waves and vehicle number. Total horizontal strain for the daytime hours recorded by a Lower Sand Hill Road DAS channel versus the number of vehicles detected by template matching. Two frequency bands are shown, f = 4.0–10.0 Hz (squares) and f = 15.0–30.0 Hz (triangles). The energy of surface waves produced by vehicles decays with decreasing wavelength and increasing propagation length; hence, the correlation improves at higher frequencies.
