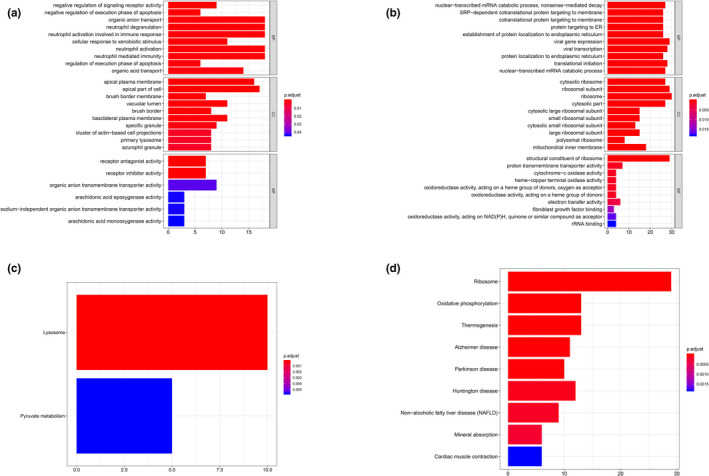
Figure 4.

GO & KEGG analysis of cluster 2. (a) GO analysis of positive top 200 co‐expression genes of ACE2 in cluster 2. (b) GO analysis of negative co‐expression genes of ACE2 in cluster 2. (c) KEGG analysis of positive top 200 co‐expression genes of ACE2 in cluster 2. (d) KEGG analysis of negative top 200 co‐expression genes of ACE2 in cluster 2. GO, Gene Ontology
