
FIGURE 2.
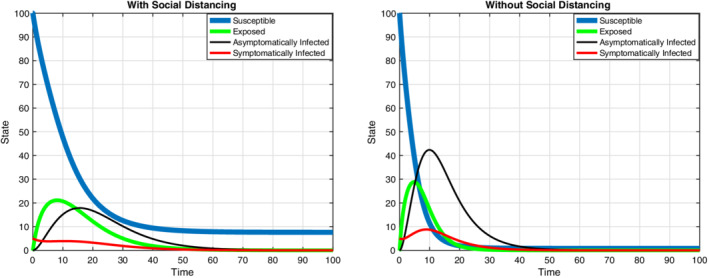
The graphs are related to the states of the system with and without social distancing with optimal control approach, S 0 = 100, m = 60. It is understood that social distancing reduces the peak and prolongs the epidemic by comparing two graphs [Colour figure can be viewed at wileyonlinelibrary.com]