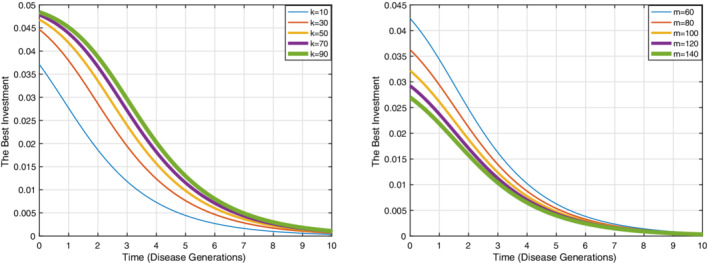
FIGURE 6.

The graphs are related to the best investment in term of time with optimal control approach. The results show that by spending time, the best investment is decreased. The left graph is depicted for different the maximum efficiencies of social distancing. k = 20. The best investment in social distancing is decreased by increasing the maximum efficiencies of social distancing (m). The right graph is depicted for different ( m = 60). By increasing the number of contacts, the best investment in social distancing is increased [Colour figure can be viewed at wileyonlinelibrary.com]
