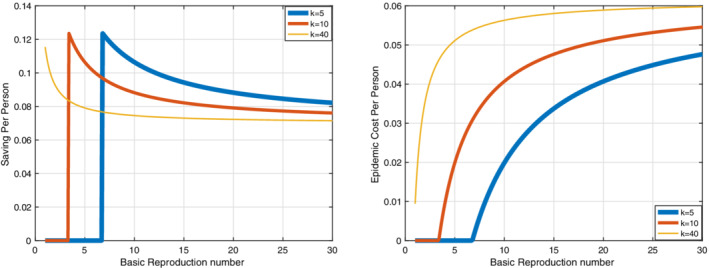
FIGURE 11.

The graphs are related to epidemic cost per person and saving in cost per person with a differential game approach. By increasing the number of contacts, epidemic cost per person is increased. The results show that for the number of low contacts, there is a peak point in the graph ( k = 1, 2,…,35). But the graph is strictly decreasing for the number of more contacts ( k = 35, 36,…). According to (b), by increasing the number of contacts, saving in cost per person is decreased. These graphs are depicted for m = 100 [Colour figure can be viewed at wileyonlinelibrary.com]
