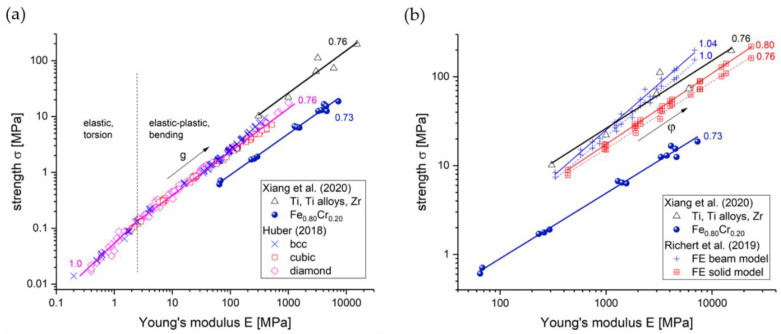
Figure 20.
Comparison of the data published by Xiang et al. [14] with the data from (a) Huber [80], Supplementary material, Data sheet 2, and (b) comparison with the data from Richert et al. [53], Supplementary material, Tables S2 and S4 (thin dashed lines correspond to yield stress, thin solid lines are unpublished data and correspond to flow stress at 10% plastic strain). Slopes entered as numbers in the plots correspond to exponents in the dependency .

