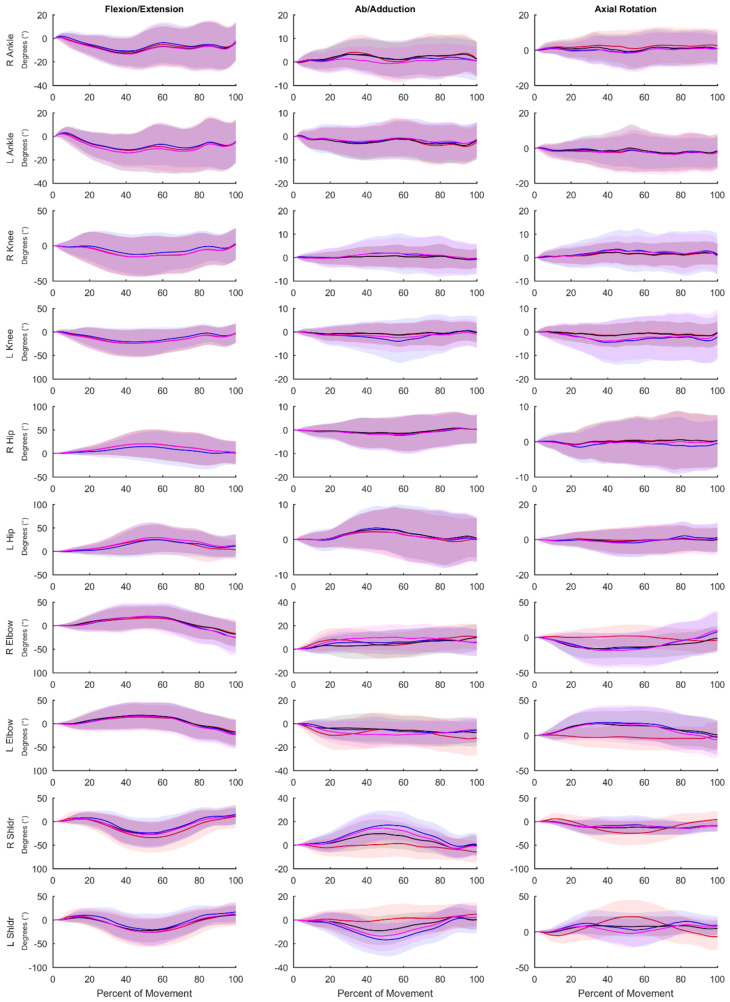
Figure 5.
Average waveforms across all movements. Blue represents data captured through OPT (VOPT); red represents data captured through IMU (XIMU); black represents IMU data processed through Visual3D (VIMU); magenta represents IMU data processed through Visual3D with the coordinate system alignment procedure (VIMU-CAL). Shaded areas represent one standard deviation from the mean trajectory and are displayed in the same colour.

