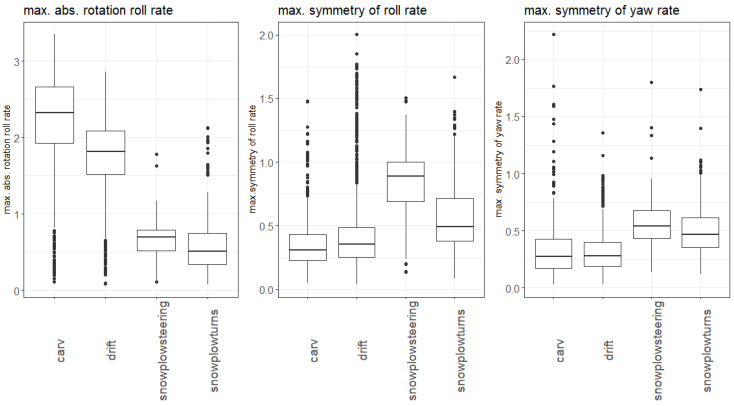
Figure 6.
Features for the parallel/non-parallel distinction. The features are visualized via boxplots which show the summary statistics. The box represents the interquartile range (IQR = third quartile–first quartile), the thick line the median. The whiskers show the minimum and maximum values without outliers (1.5*IQR), the black dots the outliers which lie outside 1.5*IQR.

