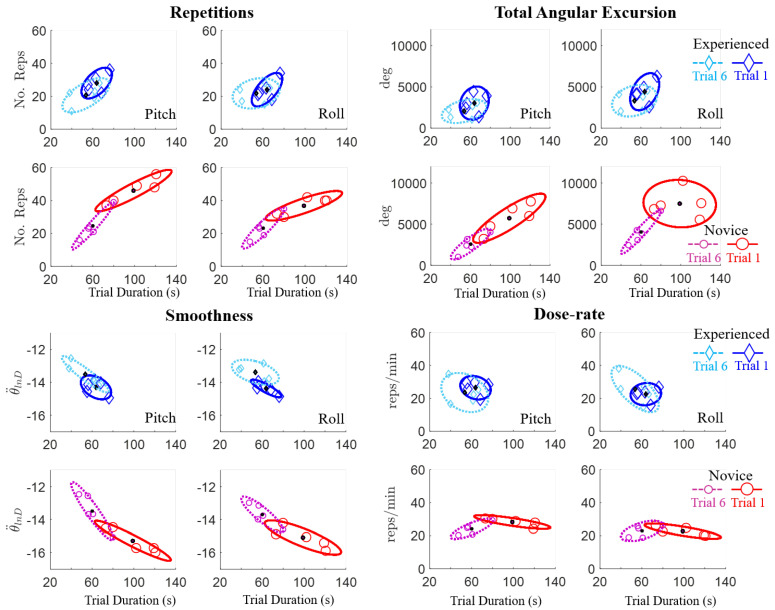
Figure 8.
Motor learning differences of experienced and novice participant groups. Motor performance metrics including the number of repetitions (No. Reps), total angular excursion (Tot. Excursion: (°)), smoothness (), and dose-rate (reps/min) for pitch and roll motions are plotted versus trial duration (s) for the first (Trial 1) and last (Trial 6) trials. Individual participant performance (diamond and circle markers) and sample-distribution ellipses (75% confidence intervals) are also shown.

