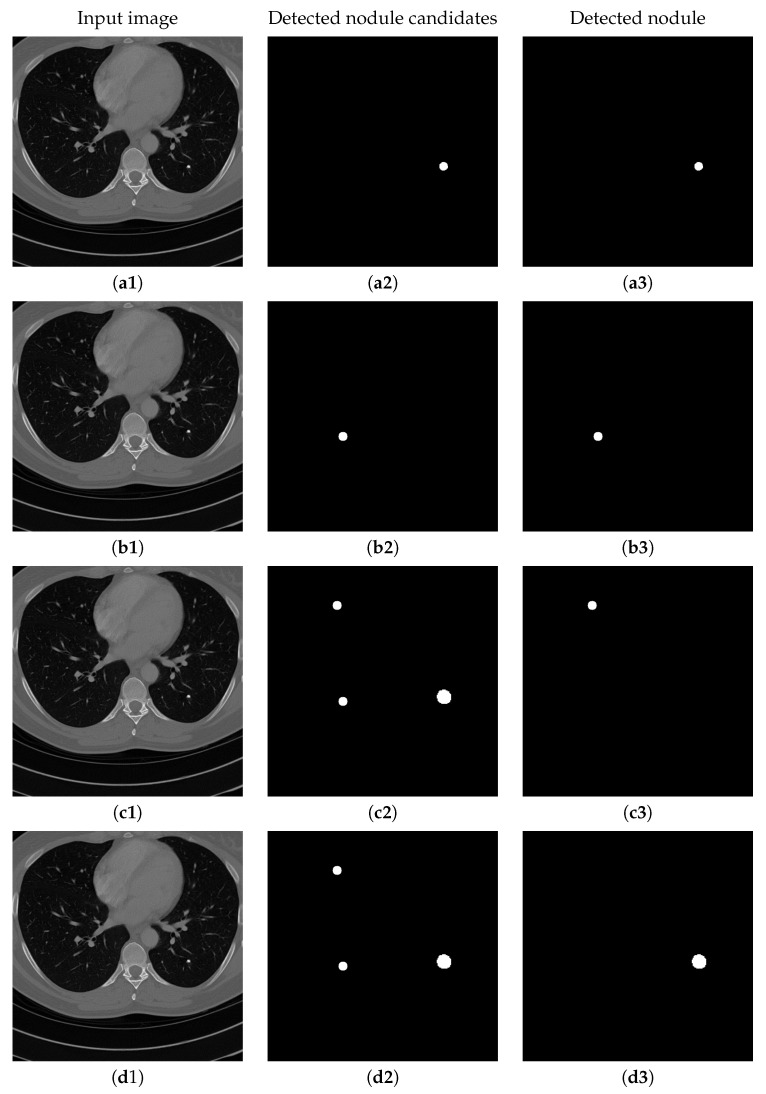
Figure 15.
The results of detecting pulmonary nodule through the proposed network with different loss strategies. Columns from left to right are: input images, detected nodule candidates, detected nodules. Rows from top to bottom are: ground truth detection results, nodule candidates and nodule detection by the proposed network with MSE loss, MSE-perceptual loss and the MSE-perceptual-dice loss.

